Figures
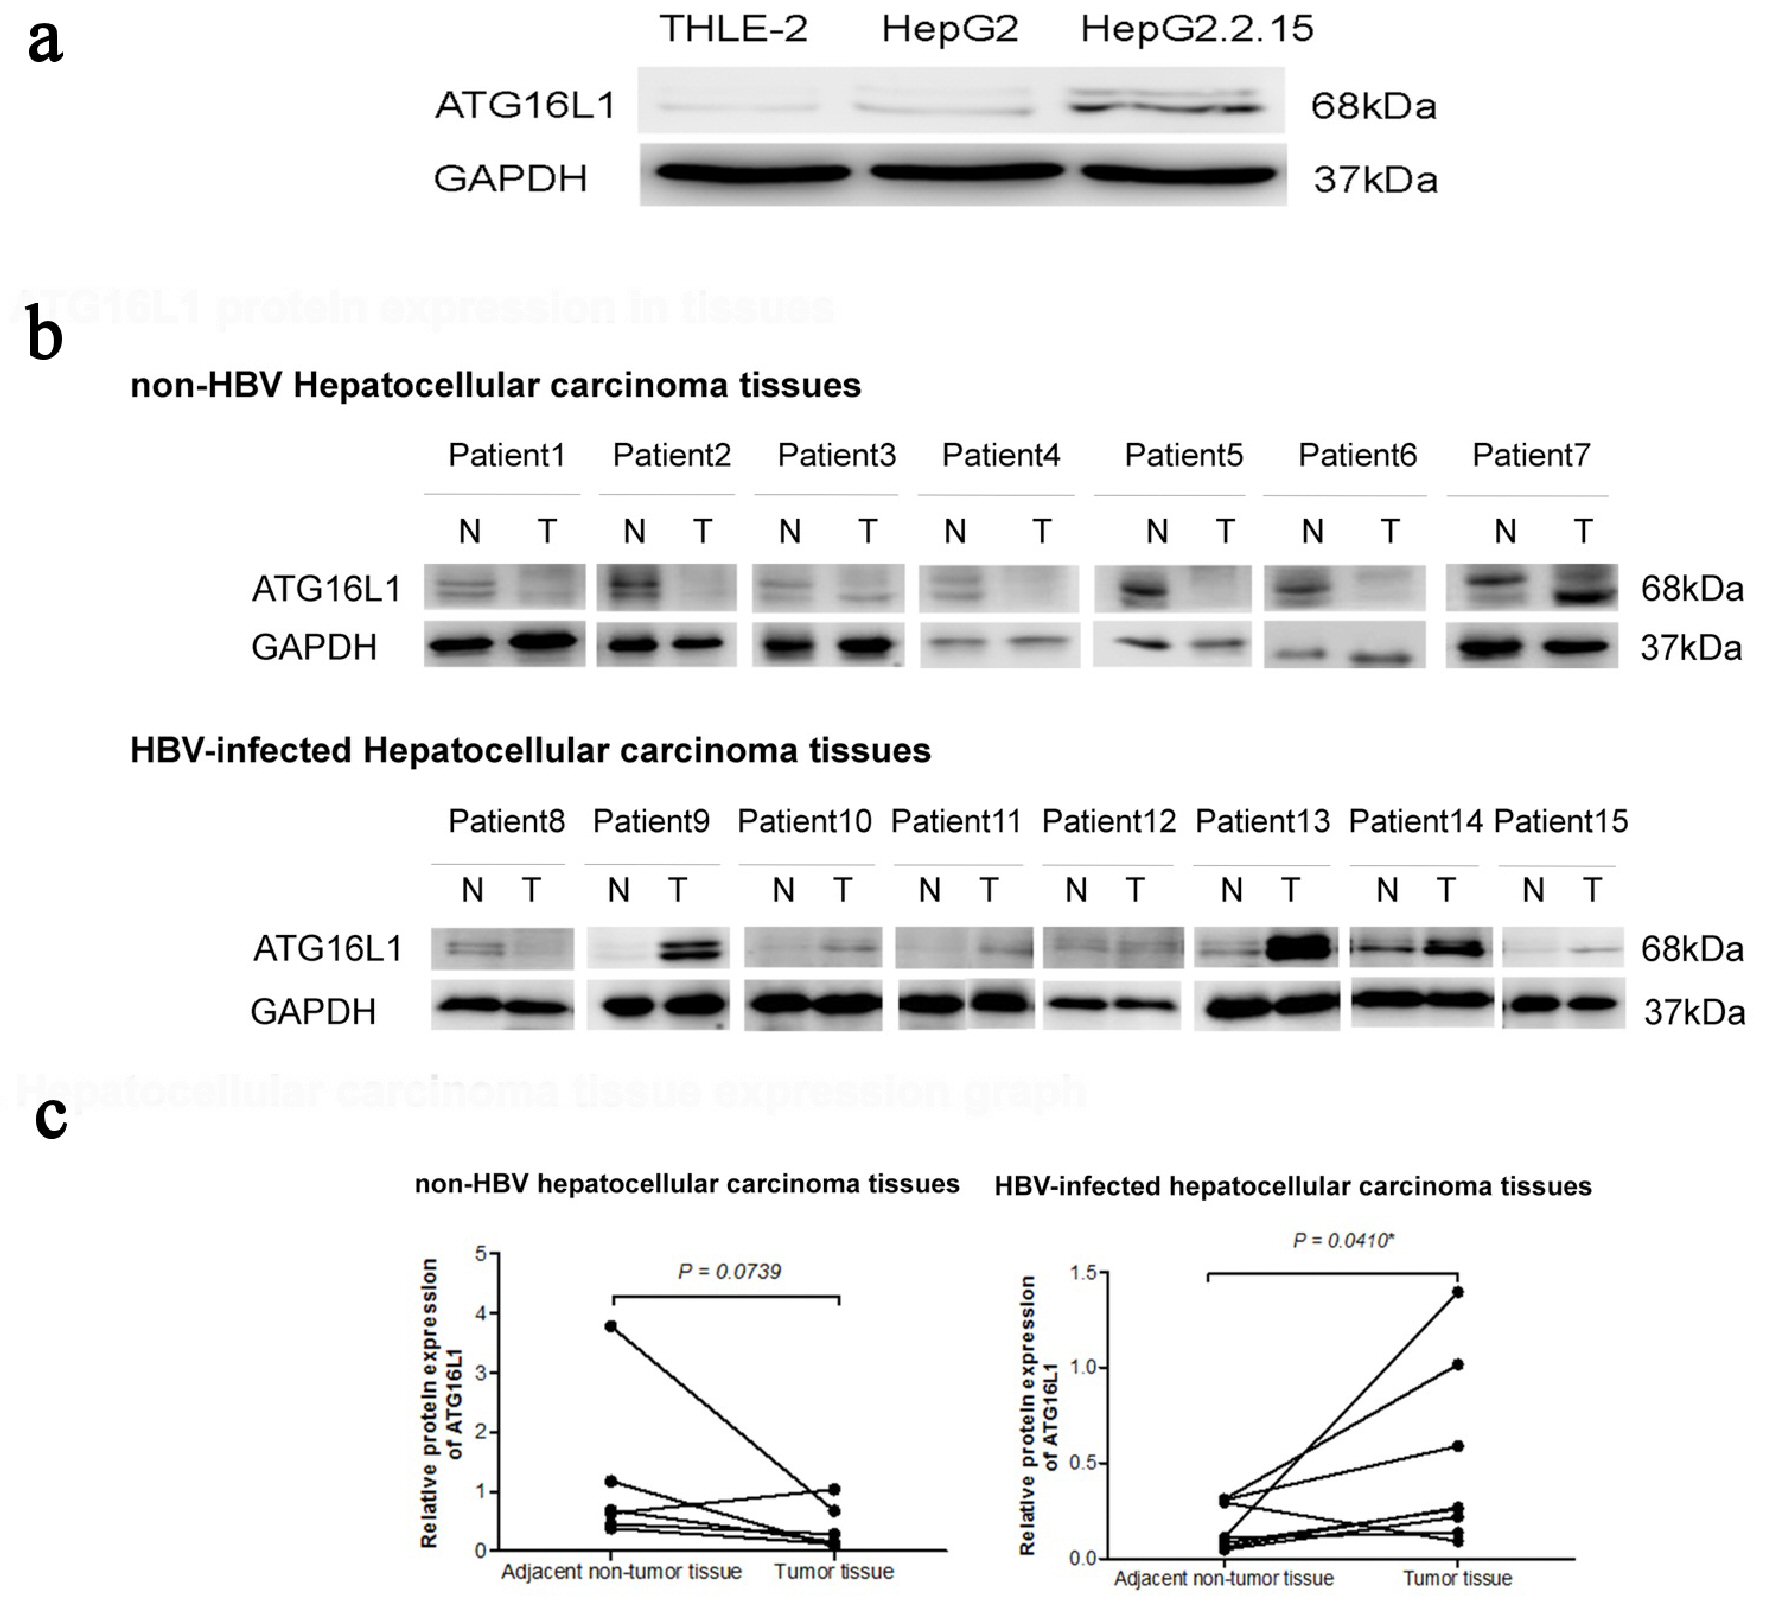
Figure 1. ATG16L1 becomes visible in the perpetual double bands at approximately 68 kDa as alpha (upper) and beta (lower) forms. (a) ATG16L1 protein expression in THLE-2, HepG2 and HepG2.2.15 cell lines, respectively. (b) Protein level in HCC liver tissues (denoted as T) and their corresponding adjacent non-tumor tissues (denoted as N). (c) The quantitative result of HCC liver tissues showing the statistic value. All results were achieved by immunoblotting analysis using monoclonal ATG16L1 antibody (68 kDa) with GAPDH used as loading control (37 kDa) under starvation condition.
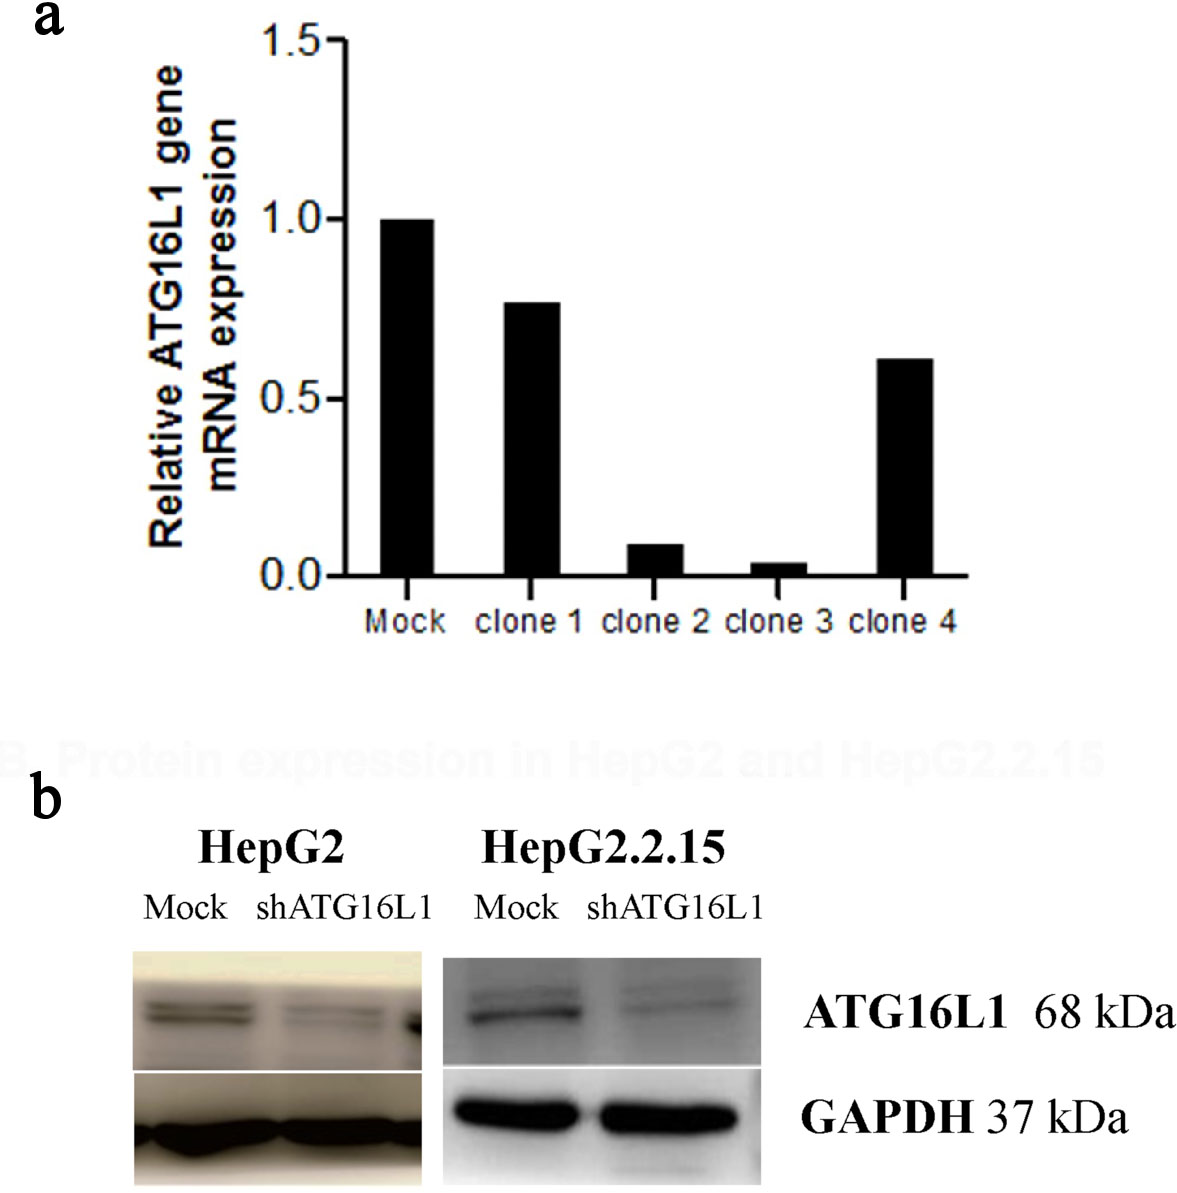
Figure 2. Plasmid clone collection. (a) ATG16L1 mRNA level in shRNA ATG16L1 clone 1-4 with its mock. (b) Decreased protein of shATG16L1 clone 3 in HepG2 and HepG2.2.15.
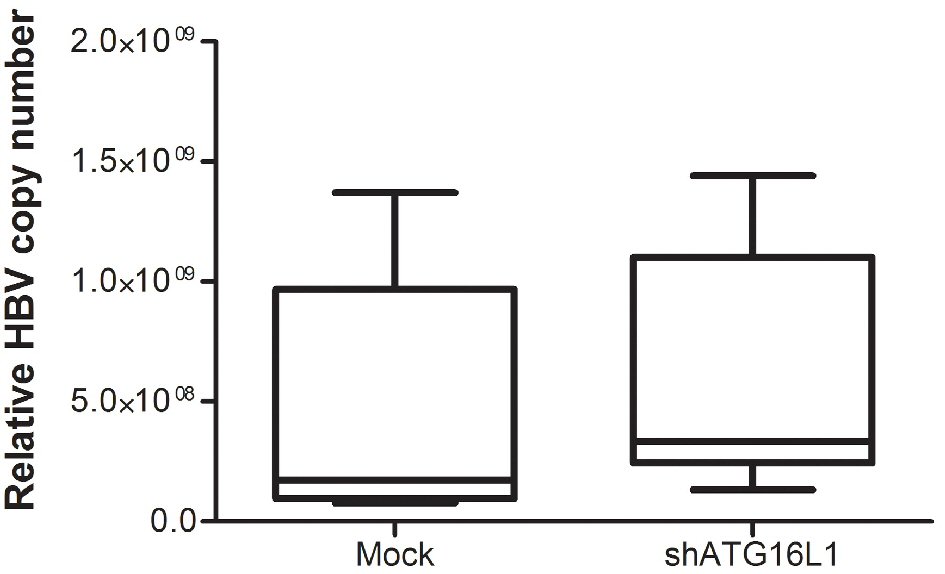
Figure 3. After starvation, HBV titer was amplified using SYBR green signal detection against preS1 specific primers in the HepG2.2.15 cell line. The assay was assessed using HBV copy number standard compared to shATG16L1 knockdown cell and its mock control. All results were performed as triplicate independent experiments.
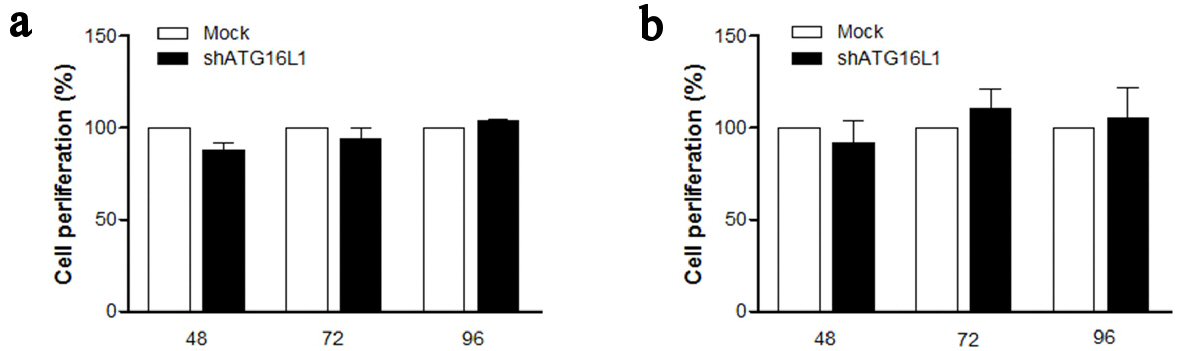
Figure 4. ATG16L1 knock down does not affect cell proliferation in HepG2 (a) and HepG2.2.15 (b) at 48, 72, and 96 h. MTS assay was used as the colorimetric method (490 nm) to determine the number of cell progressions after transfecting shATG16L1 plasmid for 24 h. Absorbance was calculated as cell proliferation percentage and shown as the relative ratio with its mock. All results were performed as triplicate independent experiments.
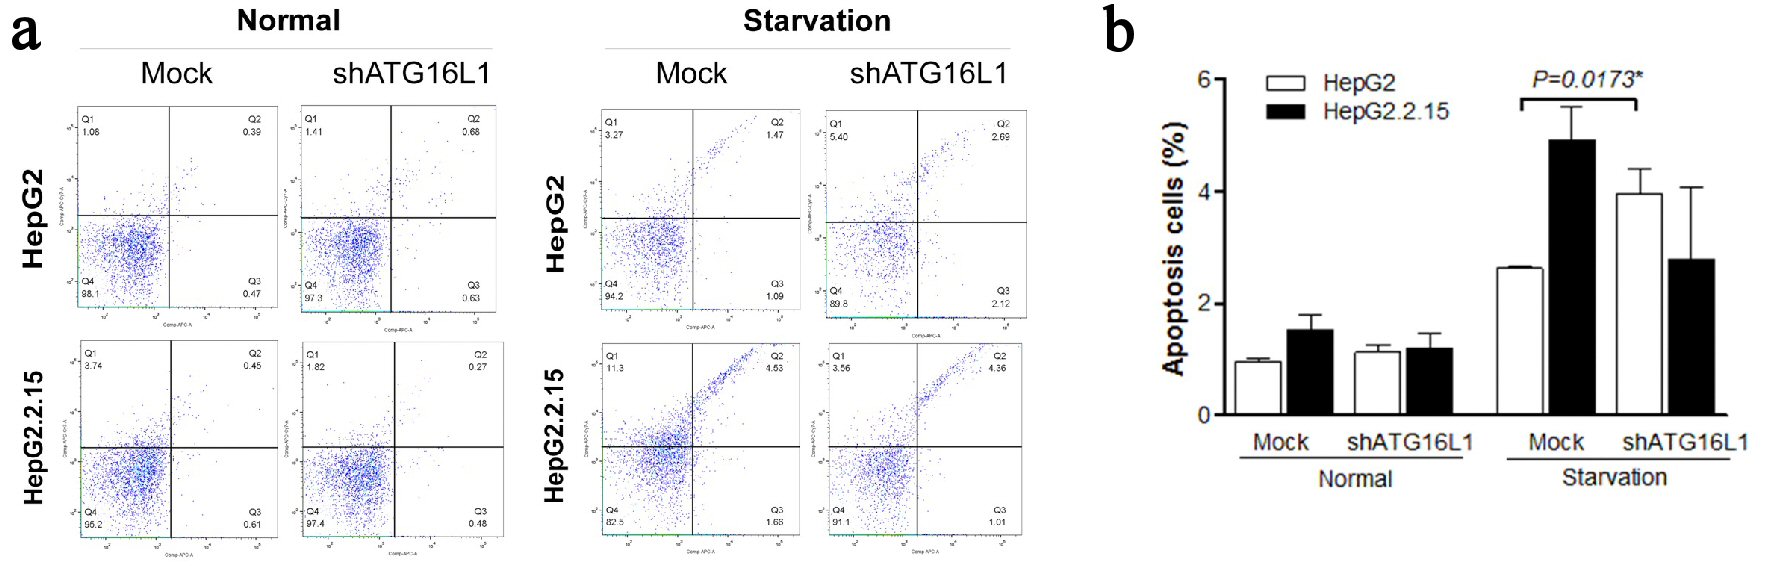
Figure 5. (a, b) ATG16L1 knock down in HepG2 and HepG2.2.15 leads to increase apoptosis in HepG2 cells under starvation, but not in HepG2.2.15 cells under starvation.