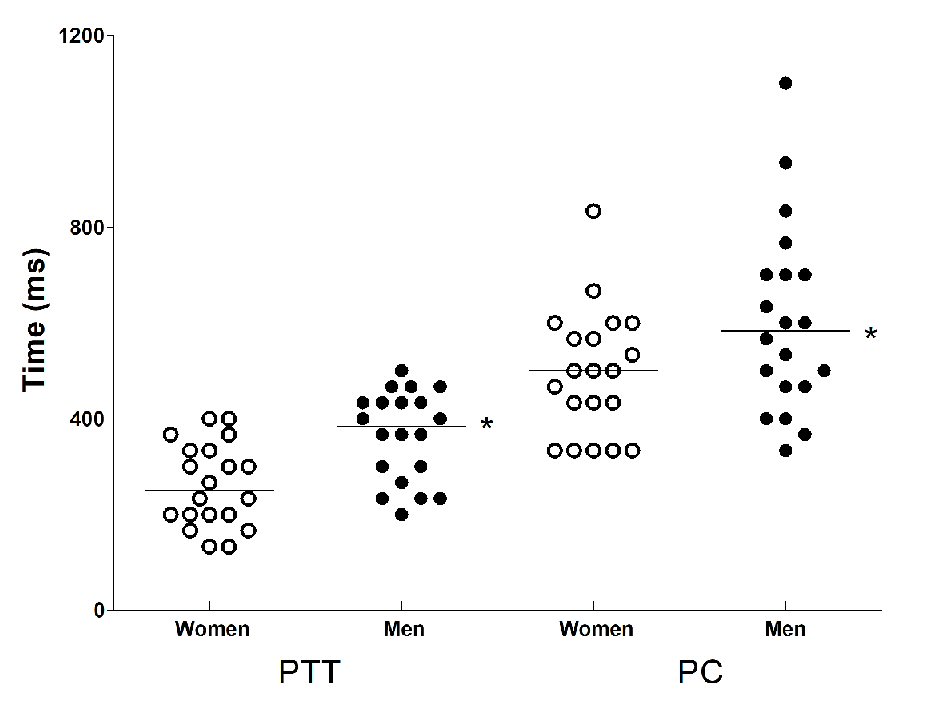
Figure 1. Pharyngeal transit time (PTT) and pharyngeal clearance (PC) in women (mean height: 166 cm) and men (mean height: 177 cm) after swallows of 10 mL liquid bolus. Horizontal bars represent the mean. *P = 0.02 vs. women.
| Gastroenterology Research, ISSN 1918-2805 print, 1918-2813 online, Open Access |
| Article copyright, the authors; Journal compilation copyright, Gastroenterol Res and Elmer Press Inc |
| Journal website http://www.gastrores.org |
Original Article
Volume 11, Number 6, December 2018, pages 411-415
Influence of Body Height on Oral and Pharyngeal Transit Time of a Liquid Bolus in Healthy Volunteers
Figures
Tables
| Shorter | Taller | P value | |||
|---|---|---|---|---|---|
| Mean | 95% CI | Mean | 95% CI | ||
| OTT: oral transit time; PTT: pharyngeal transit time; PC: pharyngeal clearance; UESO: upper esophageal sphincter opening; HM: hyoid movement; OPTT: oral-pharyngeal transit time; CI: confidence interval. | |||||
| OTT | 716 | 641 - 790 | 857 | 730 - 984 | 0.62 |
| PTT | 276 | 249 - 304 | 329 | 275 - 385 | 0.09 |
| PC | 522 | 475 - 569 | 564 | 502 - 626 | 0.06 |
| UESO | 345 | 321 - 370 | 363 | 332 - 393 | 0.29 |
| HM | 853 | 751 - 955 | 902 | 820 - 985 | 0.23 |
| OPTT | 1,024 | 921 - 1,127 | 1,169 | 1,038 - 1,301 | 0.38 |
| Shorter | Taller | P value | |||
|---|---|---|---|---|---|
| Mean | 95% CI | Mean | 95% CI | ||
| OTT: oral transit time; PTT: pharyngeal transit time; PC: pharyngeal clearance; UESO: upper esophageal sphincter opening; HM: hyoid movement; OPTT: oral-pharyngeal transit time; CI: confidence interval. | |||||
| OTT | 753 | 646 - 859 | 592 | 456 - 727 | 0.03 |
| PTT | 336 | 296 - 376 | 400 | 197 - 503 | 0.21 |
| PC | 625 | 559 - 691 | 617 | 500 - 735 | 0.33 |
| UESO | 395 | 358 - 431 | 387 | 333 - 441 | 0.71 |
| HM | 912 | 729 - 1,094 | 875 | 776 - 974 | 0.77 |
| OPTT | 1,083 | 962 - 1,204 | 1,001 | 843 - 1,159 | 0.58 |
| Shorter | Taller | P value | |||
|---|---|---|---|---|---|
| Mean | 95% CI | Mean | 95% CI | ||
| OTT: oral transit time; PTT: pharyngeal transit time; PC: pharyngeal clearance; UESO: upper esophageal sphincter opening; HM: hyoid movement; OPTT: oral-pharyngeal transit time; CI: confidence interval. | |||||
| OTT | 678 | 570 - 787 | 1,122 | 949 - 1,296 | 0.04 |
| PTT | 217 | 192 - 242 | 259 | 232 - 287 | 0.11 |
| PC | 419 | 377 - 461 | 510 | 468 - 553 | 0.02 |
| UESO | 296 | 274 - 318 | 338 | 311 - 366 | 0.12 |
| HM | 794 | 693 - 895 | 930 | 792 - 1,067 | 0.05 |
| OPTT | 965 | 793 - 1,137 | 1,338 | 1,138 - 1,538 | 0.04 |
| Men | Women | All | ||||
|---|---|---|---|---|---|---|
| r | P value | r | P value | r | P value | |
| OTT: oral transit time; PTT: pharyngeal transit time; PC: pharyngeal clearance; UESO: upper esophageal sphincter opening; HM: hyoid movement; OPTT: oral-pharyngeal transit time. | ||||||
| OTT | -0.22 | 0.35 | 0.63 | 0.01 | 0.07 | 0.68 |
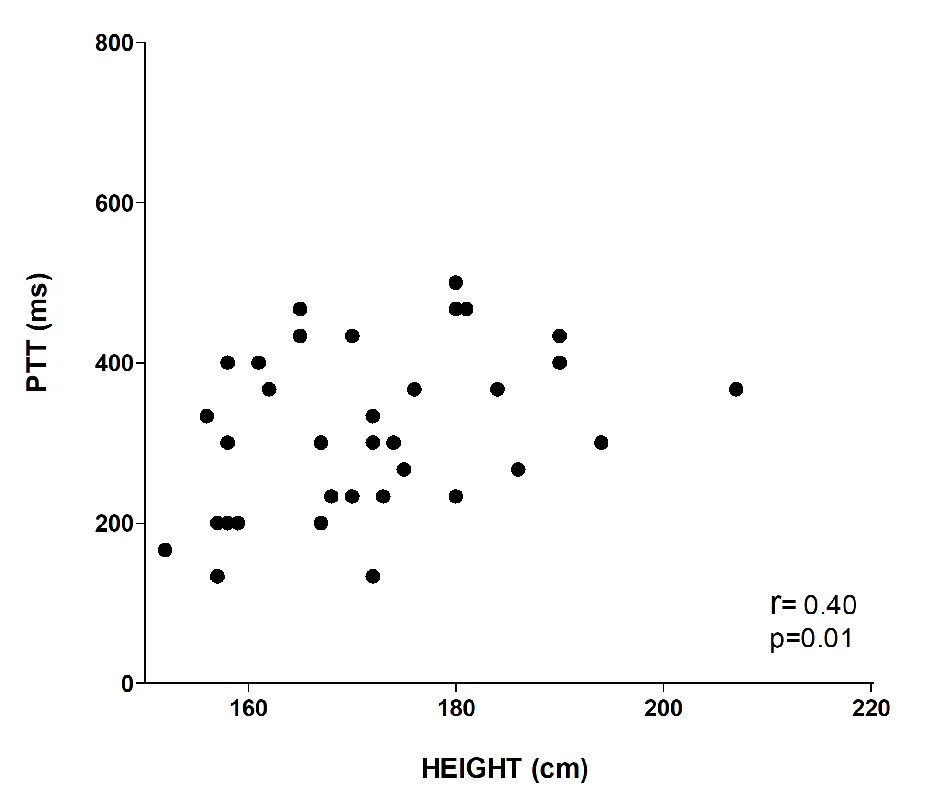
| PTT | -0.05 | 0.84 | 0.45 | 0.04 | 0.40 | 0.01 |
| PC | -0.36 | 0.12 | 0.13 | 0.58 | 0.07 | 0.68 |
| UESO | -0.16 | 0.49 | 0.38 | 0.10 | 0.19 | 0.25 |
| HM | -0.10 | 0.68 | 0.37 | 0.10 | 0.22 | 0.17 |
| OPTT | 0.11 | 0.66 | 0.69 | 0.01 | 0.22 | 0.16 |