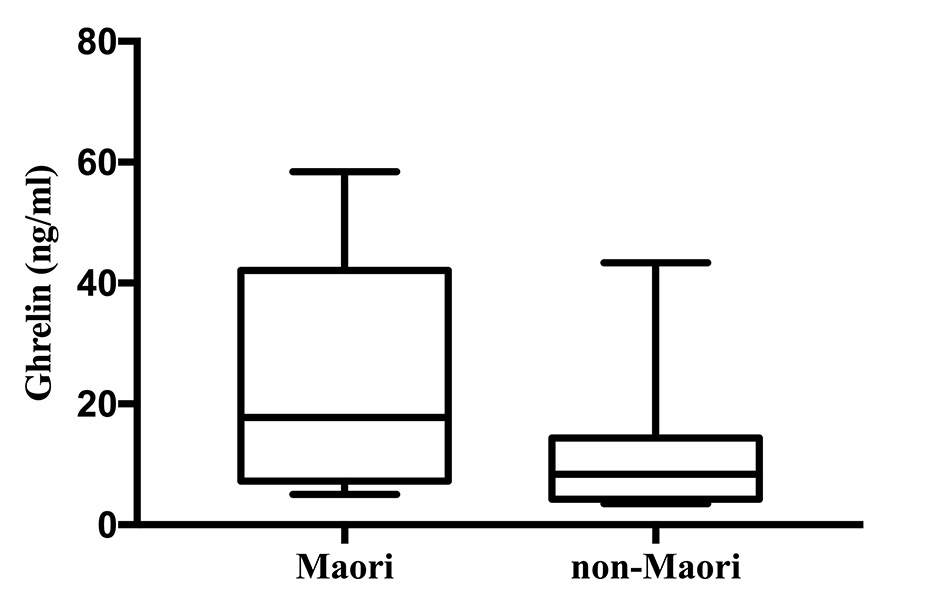
Figure 1. Ghrelin levels in Maori versus non-Maori.
| Gastroenterology Research, ISSN 1918-2805 print, 1918-2813 online, Open Access |
| Article copyright, the authors; Journal compilation copyright, Gastroenterol Res and Elmer Press Inc |
| Journal website http://www.gastrores.org |
Original Article
Volume 11, Number 4, August 2018, pages 280-289
Profile of Gut Hormones, Pancreatic Hormones and Pro-inflammatory Cytokines in New Zealand Maori
Figures
Tables
| Total | Maori | Non-Maori | P | |
|---|---|---|---|---|
| Data presented as median (interquartile range) or count values. | ||||
| No. of patients | 93 | 8 | 85 | 0.372 |
| Age, years | 53 (42 - 65) | 52 (47 - 64) | 53 (42 - 65) | 0.978 |
| Sex | ||||
| Male | 57 | 4 | 53 | 0.372 |
| Female | 36 | 4 | 32 | |
| Smoking status | 0.339 | |||
| Smoker | 69 | 5 | 64 | |
| Non-smoker | 24 | 3 | 21 | |
| Exercise | 0.548 | |||
| Yes | 61 | 2 | 59 | |
| No | 32 | 6 | 26 | |
| Body mass index, kg/m2 | 27.5 (24.6 - 30.8) | 30.6 (26.1 - 38.0) | 27.4 (24.4 - 30.6) | 0.117 |
| Diabetes mellitus | 0.205 | |||
| Yes | 10 | 2 | 8 | |
| No | 83 | 6 | 77 | |
| Etiology | 0.465 | |||
| Biliary | 43 | 3 | 40 | |
| Alcohol | 21 | 1 | 20 | |
| Other | 29 | 4 | 25 | |
| Recurrence | 0.452 | |||
| Yes | 28 | 3 | 25 | |
| No | 65 | 5 | 60 | |
| Severity | 0.562 | |||
| Mild | 73 | 6 | 67 | |
| Moderate | 14 | 2 | 12 | |
| Severe/critical | 6 | 0 | 6 | |
| Gut hormones | Model | Regression coefficient (β) | OR | 95% CI | P | |
|---|---|---|---|---|---|---|
| Lower | Upper | |||||
| OR: odds ratio; CI: confidence interval. OR indicate membership to Maori. Model 1 for all gut hormones was adjusted for age and sex. Model 2 for all gut hormones was adjusted for age, sex, smoking, exercise, BMI and diabetes mellitus. Model 3 for all gut hormones was adjusted for etiology, recurrence, time since pancreatitis and severity. Model 4 for all gut hormones was adjusted for age, sex, smoking, exercise, BMI, diabetes mellitus, etiology, recurrence, time since pancreatitis and severity. | ||||||
| Cholecystokinin | Unadjusted | 0.846 | 2.331 | 0.448 | 12.126 | 0.314 |
| 1 | 0.836 | 2.308 | 0.446 | 11.943 | 0.319 | |
| 2 | 0.643 | 1.903 | 0.351 | 10.333 | 0.456 | |
| 3 | 0.606 | 1.833 | 0.307 | 10.934 | 0.506 | |
| 4 | 0.362 | 1.437 | 0.186 | 11.081 | 0.728 | |
| Ghrelin | Unadjusted | 0.075 | 1.078 | 1.022 | 1.136 | 0.005 |
| 1 | 0.075 | 1.078 | 1.021 | 1.138 | 0.007 | |
| 2 | 0.088 | 1.092 | 1.023 | 1.166 | 0.008 | |
| 3 | 0.079 | 1.082 | 1.012 | 1.157 | 0.021 | |
| 4 | 0.105 | 1.111 | 1.012 | 1.219 | 0.027 | |
| Gastric inhibitory polypeptide | Unadjusted | 0.005 | 1.005 | 0.995 | 1.014 | 0.354 |
| 1 | 0.005 | 1.005 | 0.995 | 1.015 | 0.299 | |
| 2 | 0.005 | 1.005 | 0.994 | 1.017 | 0.371 | |
| 3 | 0.004 | 1.004 | 0.993 | 1.014 | 0.505 | |
| 4 | 0.009 | 1.009 | 0.995 | 1.023 | 0.229 | |
| Glicentin | Unadjusted | 0.077 | 1.080 | 1.017 | 1.148 | 0.013 |
| 1 | 0.081 | 1.084 | 1.018 | 1.155 | 0.012 | |
| 2 | 0.099 | 1.104 | 1.011 | 1.206 | 0.027 | |
| 3 | 0.076 | 1.079 | 1.009 | 1.153 | 0.027 | |
| 4 | 0.083 | 1.086 | 0.983 | 1.200 | 0.103 | |
| Glucagon-like peptide-1 | Unadjusted | 0.211 | 1.235 | 0.937 | 1.629 | 0.135 |
| 1 | 0.223 | 1.250 | 0.922 | 1.694 | 0.151 | |
| 2 | 0.221 | 1.247 | 0.894 | 1.740 | 0.193 | |
| 3 | 0.283 | 1.327 | 0.956 | 1.843 | 0.091 | |
| 4 | 0.415 | 1.515 | 0.962 | 2.387 | 0.073 | |
| Glucagon-like peptide-2 | Unadjusted | 0.086 | 1.090 | 0.969 | 1.226 | 0.152 |
| 1 | 0.081 | 1.084 | 0.964 | 1.220 | 0.178 | |
| 2 | 0.083 | 1.086 | 0.946 | 1.247 | 0.241 | |
| 3 | 0.089 | 1.093 | 0.957 | 1.248 | 0.191 | |
| 4 | 0.099 | 1.104 | 0.901 | 1.353 | 0.341 | |
| Oxyntomodulin | Unadjusted | -0.015 | 0.986 | 0.913 | 1.044 | 0.618 |
| 1 | -0.015 | 0.985 | 0.930 | 1.043 | 0.606 | |
| 2 | -0.022 | 0.978 | 0.921 | 1.038 | 0.466 | |
| 3 | -0.033 | 0.967 | 0.911 | 1.027 | 0.279 | |
| 4 | -0.042 | 0.959 | 0.895 | 1.028 | 0.238 | |
| Peptide YY | Unadjusted | 0.003 | 1.003 | 0.997 | 1.009 | 0.292 |
| 1 | 0.004 | 1.004 | 0.998 | 1.010 | 0.226 | |
| 2 | 0.004 | 1.004 | 0.998 | 1.011 | 0.217 | |
| 3 | 0.005 | 1.005 | 0.998 | 1.011 | 0.137 | |
| 4 | 0.006 | 1.006 | 0.999 | 1.013 | 0.111 | |
| Secretin | Unadjusted | 2.841 | 17.132 | 0.243 | 1208.835 | 0.191 |
| 1 | 2.871 | 17.663 | 0.252 | 1238.300 | 0.185 | |
| 2 | 3.511 | 33.480 | 0.275 | 4071.267 | 0.152 | |
| 3 | 1.286 | 3.618 | 0.031 | 427.932 | 0.597 | |
| 4 | 3.233 | 25.343 | 0.064 | 10080.329 | 0.290 | |
| Pancreatic hormone | Model | Regression coefficient (β) | OR | 95% CI | P | |
|---|---|---|---|---|---|---|
| Lower | Upper | |||||
| OR: odds ratio; CI: confidence interval. OR indicate for membership to Maori. Model 1 for all pancreatic hormones was adjusted for age and sex. Model 2 for all pancreatic hormones was adjusted for age, sex, smoking, exercise, BMI and diabetes mellitus. Model 3 for all pancreatic hormones was adjusted for etiology, recurrence, time since pancreatitis and severity. Model 4 for all pancreatic hormones was adjusted for age, sex, smoking, exercise, BMI, diabetes mellitus, etiology, recurrence, time since pancreatitis and severity. C-peptide values were log10 transformed. | ||||||
| Amylin | Unadjusted | -0.378 | 0.685 | 0.375 | 1.252 | 0.219 |
| 1 | -0.388 | 0.678 | 0.363 | 1.267 | 0.223 | |
| 2 | -0.934 | 0.393 | 0.157 | 0.985 | 0.046 | |
| 3 | -0.432 | 0.649 | 0.319 | 1.323 | 0.234 | |
| 4 | -1.451 | 0.234 | 0.059 | 0.937 | 0.040 | |
| C-peptide | Unadjusted | -0.476 | 0.621 | 0.083 | 4.656 | 0.643 |
| 1 | -0.595 | 0.551 | 0.063 | 4.799 | 0.590 | |
| 2 | -0.593 | 0.553 | 0.054 | 5.632 | 0.617 | |
| 3 | -0.782 | 0.457 | 0.043 | 4.860 | 0.516 | |
| 4 | -3.209 | 0.040 | 0.001 | 2.327 | 0.121 | |
| Glucagon | Unadjusted | -0.001 | 0.999 | 0.983 | 1.016 | 0.900 |
| 1 | -0.001 | 0.999 | 0.982 | 1.017 | 0.926 | |
| 2 | -0.001 | 0.999 | 0.980 | 1.019 | 0.929 | |
| 3 | -0.003 | 0.997 | 0.978 | 1.016 | 0.731 | |
| 4 | -0.002 | 0.998 | 0.976 | 1.021 | 0.869 | |
| Insulin | Unadjusted | 0.006 | 1.006 | 0.996 | 1.017 | 0.248 |
| 1 | 0.006 | 1.006 | 0.996 | 1.016 | 0.231 | |
| 2 | 0.004 | 1.004 | 0.989 | 1.020 | 0.619 | |
| 3 | 0.010 | 1.011 | 0.993 | 1.029 | 0.246 | |
| 4 | 0.006 | 1.006 | 0.985 | 1.027 | 0.593 | |
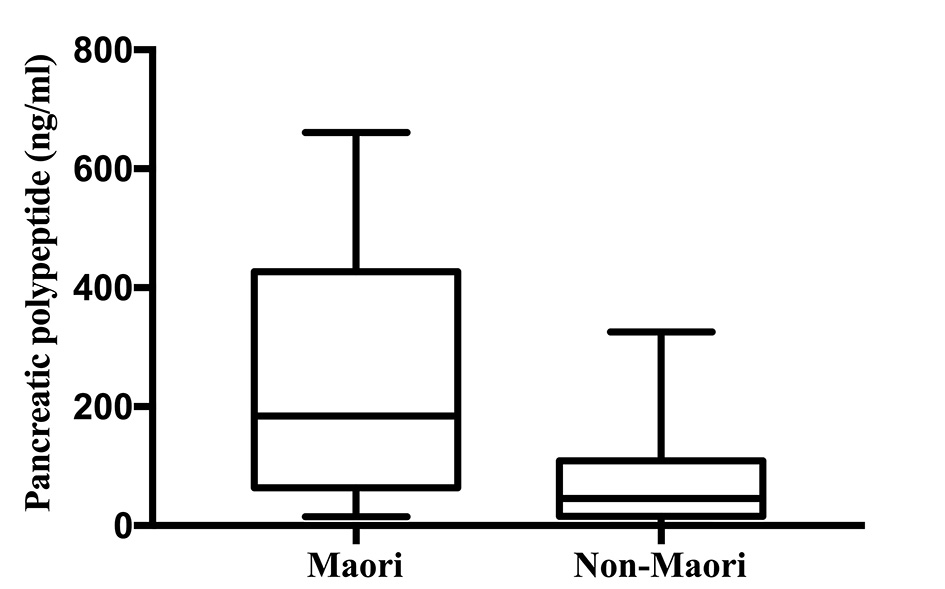
| Pancreatic polypeptide | Unadjusted | 0.011 | 1.011 | 1.003 | 1.018 | 0.004 |
| 1 | 0.011 | 1.011 | 1.004 | 1.018 | 0.003 | |
| 2 | 0.011 | 1.011 | 1.003 | 1.019 | 0.007 | |
| 3 | 0.011 | 1.011 | 1.003 | 1.019 | 0.008 | |
| 4 | 0.013 | 1.013 | 1.002 | 1.025 | 0.024 | |
| Somatostatin | Unadjusted | 1.394 | 4.031 | 0.443 | 36.648 | 0.216 |
| 1 | 1.386 | 4.001 | 0.438 | 36.558 | 0.219 | |
| 2 | 1.750 | 5.753 | 0.535 | 61.834 | 0.149 | |
| 3 | 2.189 | 8.926 | 0.555 | 143.507 | 0.122 | |
| 4 | 3.268 | 26.253 | 0.683 | 1009.537 | 0.079 | |
| Cytokies | Model | Regression coefficient (β) | OR | 95% CI | P | |
|---|---|---|---|---|---|---|
| Lower | Upper | |||||
| OR: odds ratio; CI: confidence interval. OR indicate membership to Maori. Model 1 for all cytokines was adjusted for age and sex. Model 2 for all cytokines was adjusted for age, sex, smoking, exercise, BMI and diabetes mellitus. Model 3 for all cytokines was adjusted for etiology, recurrence, time since pancreatitis and severity. Model 4 for all cytokines was adjusted for age, sex, smoking, exercise, BMI, diabetes mellitus, etiology, recurrence, time since pancreatitis and severity. | ||||||
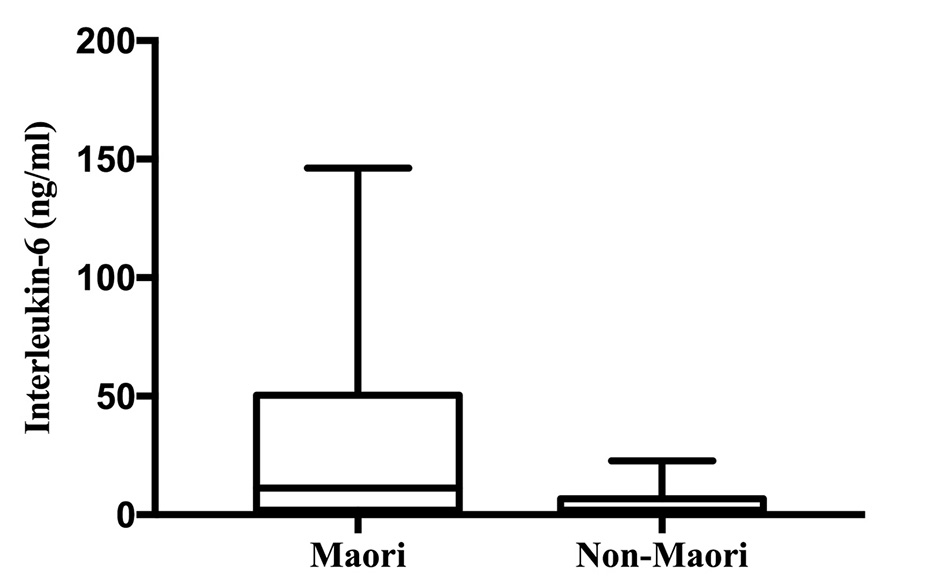
| Interleukin-6 | Unadjusted | 0.110 | 1.117 | 1.012 | 1.233 | 0.029 |
| 1 | 0.199 | 1.220 | 1.048 | 1.422 | 0.011 | |
| 2 | 0.197 | 1.218 | 1.031 | 1.438 | 0.020 | |
| 3 | 0.208 | 1.231 | 1.046 | 1.448 | 0.012 | |
| 4 | 0.228 | 1.256 | 1.016 | 1.554 | 0.035 | |
| Monocyte chemoattractant protein-1 | Unadjusted | 0.005 | 1.005 | 0.997 | 1.014 | 0.227 |
| 1 | 0.007 | 1.007 | 0.998 | 1.017 | 0.134 | |
| 2 | 0.008 | 1.008 | 0.998 | 1.019 | 0.117 | |
| 3 | 0.005 | 1.005 | 0.997 | 1.014 | 0.223 | |
| 4 | 0.012 | 1.012 | 0.999 | 1.026 | 0.070 | |
| Tumour necrosis factor-α | Unadjusted | 0.084 | 1.088 | 0.945 | 1.253 | 0.242 |
| 1 | 0.096 | 1.101 | 0.954 | 1.271 | 0.189 | |
| 2 | 0.084 | 1.088 | 0.929 | 1.273 | 0.294 | |
| 3 | 0.100 | 1.105 | 0.936 | 1.304 | 0.239 | |
| 4 | 0.186 | 1.204 | 0.963 | 1.506 | 0.103 | |