Gastroenterology Research, ISSN 1918-2805 print, 1918-2813 online, Open Access
Article copyright, the authors; Journal compilation copyright, Gastroenterol Res and Elmer Press Inc
Journal website http://www.gastrores.org

Original Article

Volume 10, Number 6, December 2017, pages 359-365


Is the Glasgow Prognostic Score Applicable to Both Early- and Advanced-Stage Gastric Cancers?

Figures

Figure 1.
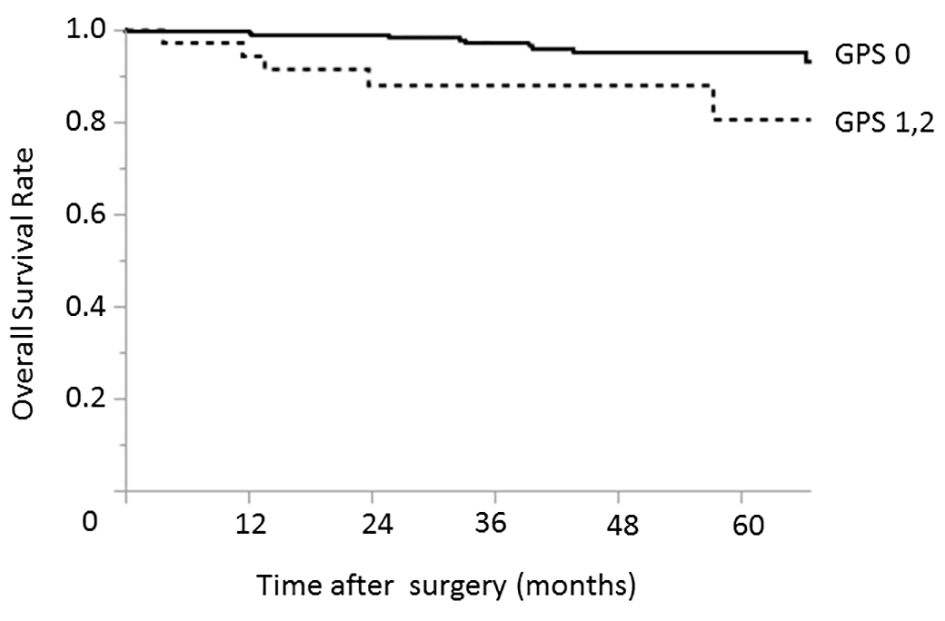
Figure 1. Relationship between the GPS and overall survival among patients with early-stage (pStage I) gastric cancer. The 3- and 5-year overall survival rates among patients with GPS of 0 were 97.1% and 95.1%, respectively; the corresponding rates among patients with GPSs of 1 - 2 were 88.1% and 80.7%, respectively. GPS: Glasgow prognostic score.
Figure 2.
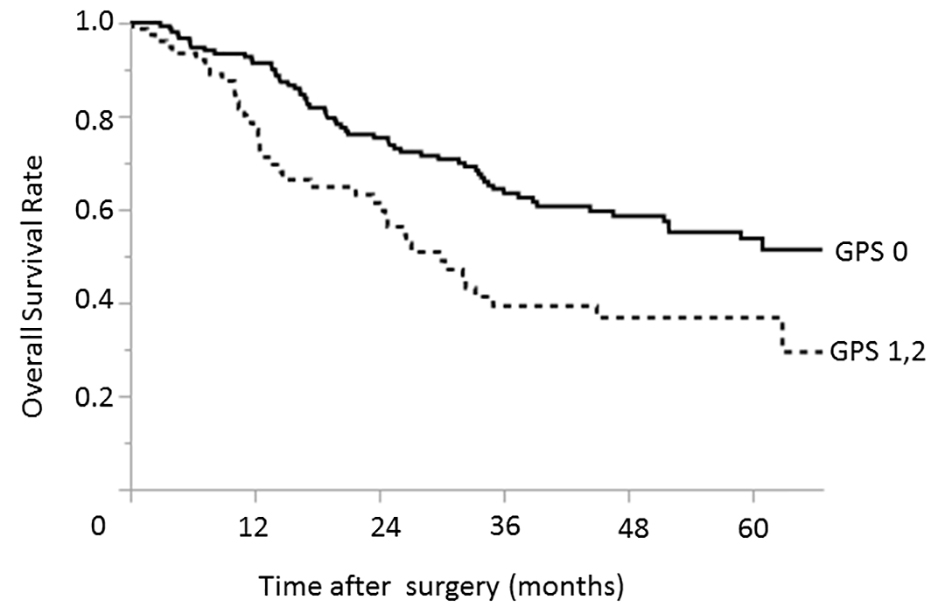
Figure 2. Relationship between the GPS and overall survival among patients with advanced-stage (pStage II, III, and IV) gastric cancers. The 3- and 5-year overall survival rates among patients with GPS of 0 were 63.5% and 53.8%, respectively; the corresponding rates among patients with GPSs of 1 - 2 were 39.3% and 36.8%, respectively. GPS: Glasgow prognostic score.

Tables

Table 1. Associations of Clinicopathological Characteristics With the Pathological Stage Among Gastric Cancer Cases
 
Total, n = 544pStage I, n = 304pStage II, III, IV, n = 240P value
BMI: body mass index; ASA PS: American Society of Anesthesiologists physical status; eGFR: estimated glomerular filtration rate; CRP: C-reactive protein; CEA: carcinoembryonic antigen; CA19-9: carbohydrate antigen 19-9; GPS: Glasgow prognostic score. aThe sum of these values does not reach 544 because data were missing for some patients. bPatients with grade II or higher postoperative complications (Clavien-Dindo classification) are classified as (+).
Age (years)< 0.001*
  < 75373225 (74.0%)148 (61.7%)
  ≥ 7517179 (26.0%)92 (38.3%)
Sex0.276
  Male379206 (67.8%)173 (72.1%)
  Female16598 (32.2%)67 (27.9%)
BMI (kg/m2)a0.007*
  < 184720 (6.6%)27 (11.3%)
  ≥ 18496284 (93.4%)212 (88.3%)
Comorbidity0.931
  (+)366205 (67.4%)161 (67.1%)
  (-)17899 (32.6%)79 (32.9%)
ASA PS0.116
  1, 2455261 (85.9%)194 (80.8%)
  3, 48943 (14.1%)46 (19.2%)
Laboratory data
  eGFR (mL/min/1.73 m2)0.2132
    < 6011860 (19.7%)58 (24.2%)
    ≥ 60426244 (80.3%)182 (75.8%)
  Albumin (g/dL)a< 0.001*
    < 3.59226 (8.6%)66 (27.5%)
    ≥ 3.5434267 (87.8%)167 (69.6%)
  Lymphocytes (cells/µL)0.018*
    < 1,20011151 (16.8%)60 (25.0%)
    ≥ 1,200433253 (83.2%)180 (75.0%)
  CRP (mg/dL)a0.012*
    ≤ 1.0496284 (93.4%)212 (88.3%)
    > 1.04517 (5.6%)28 (11.7%)
CEA (ng/mL)a< 0.001*
  ≤ 5.0443261 (85.9%)182 (75.8%)
  > 5.08631 (10.1%)55 (22.9%)
CA19-9 (ng/mL)a< 0.001*
  ≤ 37448267 (87.8%)181 (75.4%)
  > 377021 (6.9%)49 (20.4%)
GPSa< 0.001*
  0407252 (82.9%)155 (64.6%)
  19735 (11.5%)62 (25.8%)
  2204 (1.3%)16 (6.7%)
Macroscopic type< 0.001*
  Type 4281 (0.3%)27 (11.3%)
  Other than type 4516303 (99.7%)213 (88.8%)
Tumor location< 0.001*
  Upper third16969 (22.7%)100 (41.7%)
  Middle or lower third375235 (77.3%)140 (58.3%)
Postoperative morbidityb< 0.001*
   (+)10540 (13.2%)65 (27.1%)
   (-)439264 (86.8%)175 (72.9%)


Table 2. Univariate and Multivariate Analyses of Clinicopathological Variables Associated With Overall Survival in All Gastric Cancer Patients
 
VariablesUnivariate analysisMultivariate analysis
HR95% CIP valueHR95% CIP value
HR: hazard ratio; CI: confidence interval; BMI: body mass index; ASA PS: American Society of Anesthesiologists physical status; eGFR: estimated glomerular filtration rate; CRP: C-reactive protein; CEA: carcinoembryonic antigen; CA19-9: carbohydrate antigen 19-9; GPS: Glasgow prognostic score.
Age (≥ 75 vs. < 75 years)1.6210.429 - 0.8970.012*1.1520.767 - 1.7080.491
Sex (male vs. female)1.3630.919 - 2.0770.126
BMI (< 18 vs. ≥ 18 kg/m2)1.5830.885 - 2.6280.116
Comorbidity (+ vs. -)1.0130.705 - 1.4780.944
ASA PS (3, 4 vs. 1, 2)1.8201.157 - 2.7590.011*1.4550.891 - 2.3010.130
eGFR (< 60 vs. ≥ 60 mL/min/1.73 m2)1.0620.676 - 1.6100.785
Albumin (< 3.5 vs. ≥ 3.5 g/dL)2.6771.776 - 3.944< 0.001*
Lymphocytes (< 1,200 vs. ≥ 1,200 cells/µL)1.1980.768 - 1.8070.414
CRP (> 1.0 vs. ≤ 1.0 mg/dL)2.5071.491 - 3.988< 0.001*
CEA (> 5.0 vs. ≤ 5.0 ng/mL)2.5181.666 - 3.713< 0.001*1.5370.970 - 2.3770.067
CA19-9 (> 37 vs. ≤ 37 ng/mL)2.9821.938 - 4.460< 0.001*2.3901.475 - 3.768< 0.001*
GPS (1, 2 vs. 0)2.9282.008 - 4.219< 0.001*2.4621.646 - 3.644< 0.001*
Macroscopic type (type 4 vs. others)4.5212.719 - 7.139< 0.001*3.6131.999 - 6.264< 0.001*
Location (upper vs. middle or lower third)2.0381.424 - 2.901< 0.001*1.3080.855 - 1.9700.212
Postoperative morbidity (+ vs. -)1.9541.306 - 2.8600.002*1.3140.845 - 2.0010.220


Table 3. Univariate and Multivariate Analyses of Clinicopathological Variables Associated With Overall Survival in Patients With Stage I Gastric Cancer
 
VariablesUnivariate analysisMultivariate analysis
HR95% CIP valueHR95% CIP value
HR: hazard ratio; CI: confidence interval; BMI: body mass index; ASA PS: American Society of Anesthesiologists physical status; eGFR: estimated glomerular filtration rate; CRP: C-reactive protein; CEA: carcinoembryonic antigen; CA19-9: carbohydrate antigen 19-9; GPS: Glasgow prognostic score.
Age (≥ 75 vs. < 75 years)0.9840.279 - 2.7370.978
Sex (male vs. female)1.8770.681 - 6.5870.237
BMI (< 18 vs. ≥ 18 kg/m2)0.6430.036 - 3.1370.647
Comorbidity (+ vs. -)2.1220.769 - 7.4500.154
ASA PS (3, 4 vs. 1, 2)2.6630.858 - 6.9870.0861.9710.609 - 5.4630.239
eGFR (< 60 vs. ≥ 60 mL/min/1.73 m2)2.1330.749 - 5.4040.146
Albumin (< 3.5 vs. ≥ 3.5 g/dL)1.3510.214 - 4.7200.699
Lymphocytes (< 1,200 vs. ≥ 1,200 cells/µL)0.5960.094 - 2.0820.459
CRP (> 1.0 vs. ≤ 1.0 mg/dL)3.6760.854 - 11.0670.075
CEA (> 5.0 vs. ≤ 5.0 ng/mL)0.5180.029 - 2.5160.479
CA19-9 (> 37 vs. ≤ 37 ng/mL)3.8241.082 - 10.6990.039*3.9421.104 - 11.1900.037*
GPS (1, 2 vs. 0)2.7650.893 - 7.2360.0752.6820.827 - 7.4230.095
Location (upper vs. middle or lower third)0.7370.171 - 2.2230.616
Postoperative morbidity (+ vs. -)0.9410.149 - 3.2950.935


Table 4. Univariate and Multivariate Analyses of Clinicopathological Variables Associated With Overall Survival Among Patients With Stage II, III and IV Gastric Cancer
 
VariablesUnivariate analysisMultivariate analysis
HR95% CIP valueHR95% CIP value
HR: hazard ratio; CI: confidence interval; BMI: body mass index; ASA PS: American Society of Anesthesiologists physical status; eGFR: estimated glomerular filtration rate; CRP: C-reactive protein; CEA: carcinoembryonic antigen; CA19-9: carbohydrate antigen 19-9; GPS: Glasgow prognostic score.
Age (≥ 75 vs. < 75 years)1.4690.984 - 2.1660.0601.2270.796 - 1.8730.350
Sex (male vs. female)1.1450.750­ - 1.8050.538
BMI (< 18 vs. ≥ 18 kg/m2)1.3950.760 - 2.3690.266
Comorbidity (+ vs. -)0.9370.635 - 1.3990.746
ASA PS (3, 4 vs. 1, 2)1.7391.050 - 2.7510.033*1.7901.054 - 2.9180.032*
eGFR (< 60 vs. ≥ 60 mL/min/1.73 m2)1.2180.765 - 2.0370.417
Albumin (< 3.5 vs. ≥ 3.5 g/dL)1.7011.103 - 2.5650.017*
Lymphocytes (< 1,200 vs. ≥ 1,200 cells/µL)1.0620.665 - 1.6380.794
CRP (> 1.0 vs. ≤ 1.0 mg/dL)1.7340.981 - 2.8670.058
CEA (> 5.0 vs. ≤ 5.0 ng/mL)2.1141.375 - 3.180<0.001*1.6261.017 - 2.5450.043*
CA19-9 (> 37 vs. ≤ 37 ng/mL)1.9561.226 - 3.0220.006*1.7011.013 - 2.7770.045*
GPS (1, 2 vs. 0)1.8951.262 - 2.8130.002*1.6921.101 - 2.5770.017*
Macroscopic type (type 4 vs. others)2.0641.233 - 3.2870.007*2.0331.127 - 3.5180.020*
Location (upper vs. middle or lower third)1.5551.059 - 2.2780.025*1.2850.823 - 1.9880.267
Postoperative morbidity (+ vs. -)1.4150.927 - 2.1160.106