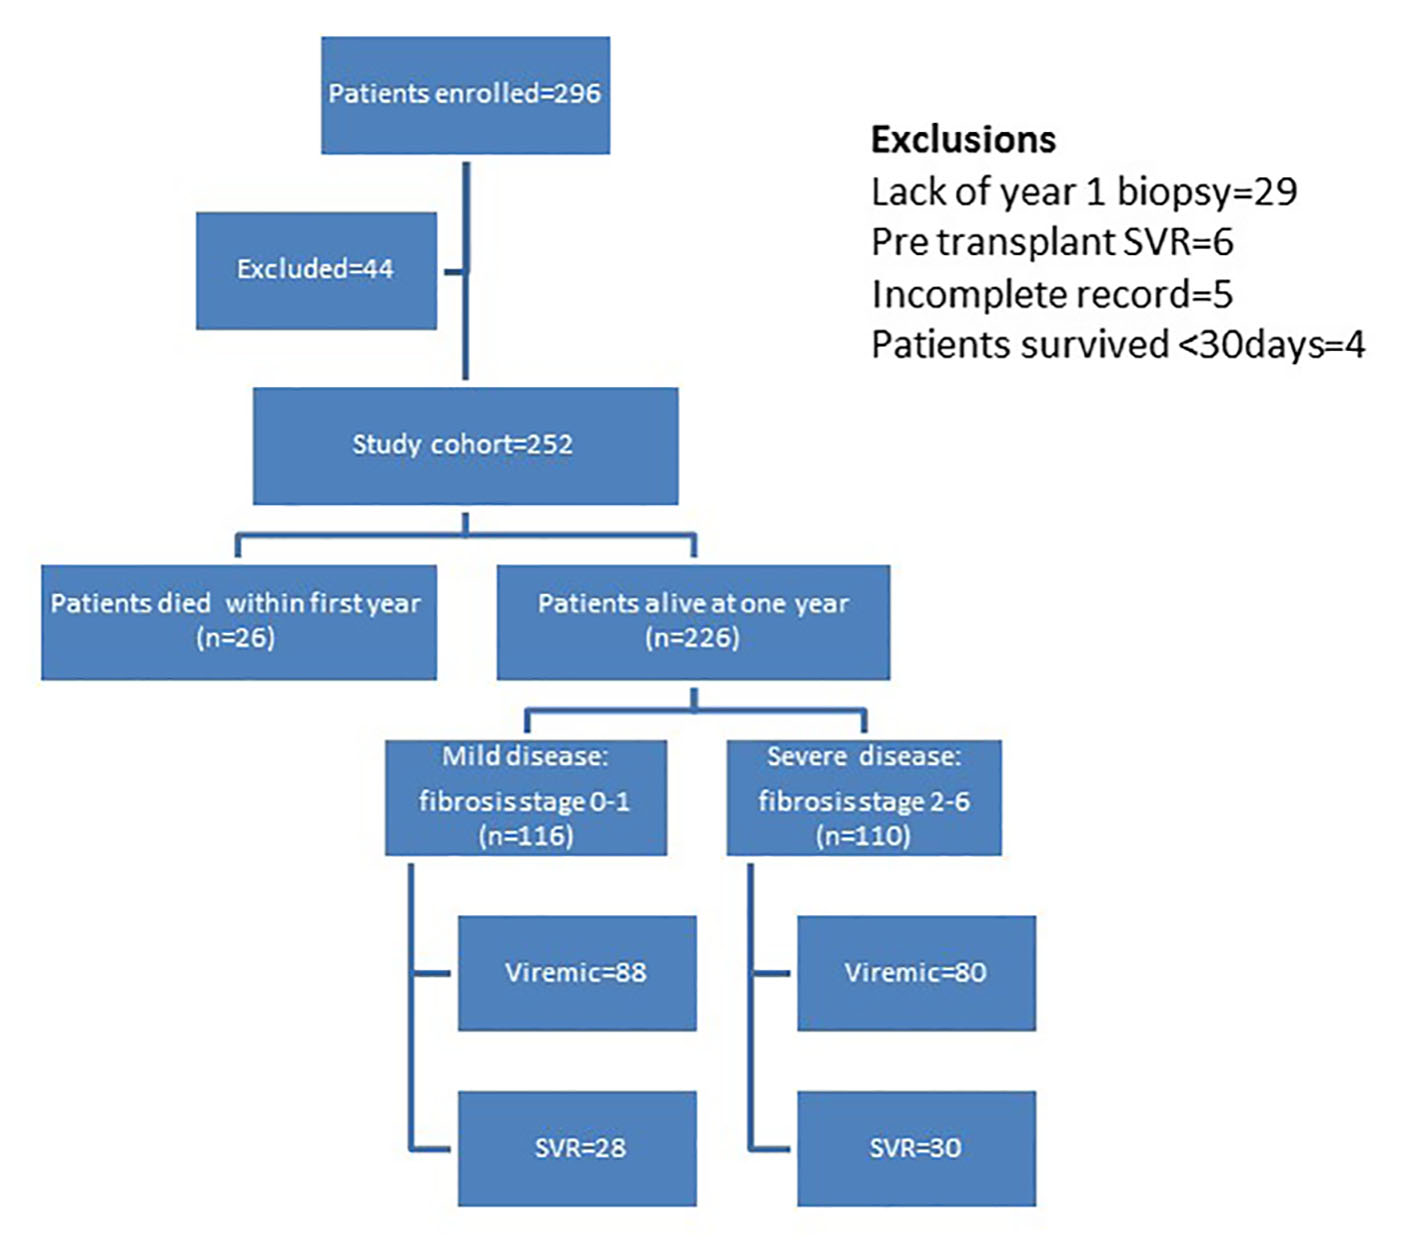
Figure 1. Distribution of patients in study cohort.
| Gastroenterology Research, ISSN 1918-2805 print, 1918-2813 online, Open Access |
| Article copyright, the authors; Journal compilation copyright, Gastroenterol Res and Elmer Press Inc |
| Journal website http://www.gastrores.org |
Original Article
Volume 8, Number 6, December 2015, pages 281-290
Hepatitis C in Liver Allograft Recipients: Utility of One-Year Post-Transplantation Biopsy as an Indicator of Antiviral Therapy
Figures
Tables
| Mild disease (n = 116) | Severe disease (n = 136) | P value | |
|---|---|---|---|
| All values are shown as mean ± SD or proportion as appropriate. Comparison by two-tailed t-test or Chi-square test as appropriate. n: number. SD: standard deviation. | |||
| Age (years) | 52 ± 7 | 51 ± 6 | 0.06 |
| Gender (male) | 98 (84%) | 96 (71%) | 0.009 |
| Caucasian | 107 (92%) | 124 (91%) | 0.76 |
| Child-Pugh status | 0.14 | ||
| Class A | 12 (10%) | 6 (4%) | |
| Class B | 69 (59%) | 80 (59%) | |
| Class C | 35 (30%) | 50 (37%) | |
| Child-Pugh score | 9 ± 1.8 | 9 ± 1.6 | 0.12 |
| MELD score | 16 ± 7 | 16 ± 8 | 0.87 |
| Blood group | 0.62 | ||
| A | 40 (34%) | 56 (41%) | |
| B | 11 (9%) | 14 (10%) | |
| AB | 9 (8%) | 7 (5%) | |
| O | 56 (48%) | 59 (43%) | |
| Co-morbidities | |||
| Diabetes mellitus | 35 (30%) | 37 (27%) | 0.60 |
| Hypertension | 43 (37%) | 43 (32%) | 0.36 |
| BMI (kg/m2) | 29 ± 5 | 28 ± 5 | 0.12 |
| Obesity (BMI ≥ 30) | 44 (38%) | 43 (32%) | 0.29 |
| Renal Failure | 16 (14%) | 22 (16%) | 0.60 |
| Hepatocellular carcinoma | 32 (28%) | 37 (27%) | 0.95 |
| Mild disease (n = 116) | Severe disease (n = 136) | P value | |
|---|---|---|---|
| All values are shown as mean ± SD or proportion as appropriate. Comparison by two-tailed t-test or Chi-square test as appropriate. *n = 209. **n = 238; data unavailable in 14 patients (mild disease: 5, severe disease: 9). ***Cytomegalovirus antibody (positive: > 4 IU/L). ****Epstein-Barr viral capsid antigen antibody (positive: > 20 IU/L); n = 243. n: number. SD: standard deviation; IU: international units. | |||
| Hemoglobin (g/dL) | 12.0 ± 2.1 | 11.7 ± 2.1 | 0.20 |
| WBC (× 103/L) | 5.0 ± 2.7 | 5.9 ± 4.0 | 0.04 |
| Platelets (× 103/L) | 67 ± 40 | 74 ± 50 | 0.25 |
| Bilirubin (mg/dL) | 4.1 ± 6.2 | 4.6 ± 7.4 | 0.55 |
| ALT (IU/L) | 131 ± 411 | 152 ± 420 | 0.69 |
| AST (IU/L) | 334 ± 1926 | 255 ± 914 | 0.67 |
| ALP (IU/L) | 166 ± 106 | 164 ± 88 | 0.87 |
| γGTP (IU/L) | 97 ± 116 | 95 ± 97 | 0.89 |
| Albumin (g/dL) | 2.9 ± 0.5 | 2.8 ± 0.6 | 0.29 |
| INR | 1.4 ± 0.4 | 1.4 ± 0.5 | 0.95 |
| Creatinine (mg/dL) | 1.3 ± 1.3 | 1.4 ± 1.4 | 0.77 |
| HCV RNA (× 106 IU/mL)* | 1.02 ± 3.4 | 2.0 ± 6.4 | 0.16 |
| HCV genotype 1** | 89 (81%) | 111 (87%) | 0.22 |
| Anti-CMV, IgG (IU/L) | 105 ± 122 | 102 ± 126 | 0.86 |
| Anti-CMV, IgG-positive*** | 81 (70%) | 81 (60%) | 0.09 |
| Anti-EBV, IgG (IU/L) | 251 ± 222 | 242 ± 196 | 0.75 |
| Anti-EBV, IgG-positive**** | 79 (71%) | 101 (77%) | 0.24 |
| Mild disease (n = 116) | Severe disease (n = 136) | P value | |
|---|---|---|---|
| All values are shown as mean ± SD or proportion as appropriate. Comparison by two-tailed t-test or Chi-square test as appropriate. *n = 247. **n = 243. ***n = 245. n: number. SD: standard deviation; anti-HCV: antibody to hepatitis C virus; anti-HBc: antibody to hepatitis B core antigen; CMV: cytomegalovirus. | |||
| Age (years) | 41 ± 17 | 45 ± 16 | 0.026 |
| Males | 68 (59%) | 78 (57%) | 0.84 |
| Caucasian | 96 (83%) | 120 (88%) | 0.21 |
| Living donor | 9 (8%) | 14 (10%) | 0.49 |
| Anti-HCV positive* | 13 (11%) | 22 (17%) | 0.25 |
| Anti-HBc positive** | 13 (12%) | 14 (11%) | 0.86 |
| Anti-CMV IgG positive*** | 70 (63%) | 82 (61%) | 0.76 |
| Donor biopsy | 61 (53%) | 82 (60%) | 0.22 |
| Blood group | 0.83 | ||
| A | 39 (34%) | 52 (38%) | |
| B | 13 (11%) | 13 (10%) | |
| AB | 7 (6%) | 6 (4%) | |
| O | 57 (49%) | 65 (48%) | |
| Donor recipient mismatch | |||
| Gender | 48 (41%) | 58 (43%) | 0.84 |
| Racial | 24 (21%) | 26 (19%) | 0.75 |
| ABO blood group | 5 (4%) | 7 (5%) | 0.76 |
| Mild disease (n = 116) | Severe disease (n = 136) | P value | |
|---|---|---|---|
| All values are shown as mean ± SD or proportion as appropriate. Comparison by two-tailed t-test or Chi-square test as appropriate. *n = 246. n: number. SD: standard deviation. | |||
| Cold ischemia time (h) | 9.8 ± 3.4 | 9.9 ± 3.9 | 0.82 |
| Warm ischemia time (min) | 34 ± 11 | 33 ± 10 | 0.24 |
| Red cell transfusion (unit)* | 7.5 ± 6.7 | 8.5 ± 7.5 | 0.28 |
| Platelets (unit) | 6.2 ± 8.1 | 7.7 ± 9.4 | 0.20 |
| Fresh frozen plasma (unit)* | 6.4 ± 6.6 | 7.6 ± 7.3 | 0.20 |
| Piggyback graft placement | 98 (84%) | 117 (86%) | 0.73 |
| Duct-duct anastomosis | 110 (95%) | 129 (95%) | 1.0 |
| T-tube placement | 77 (66%) | 96 (71%) | 0.47 |
| Veno-venous bypass | 81 (70%) | 94 (69%) | 0.90 |
| Length of stay post-transplant (days) | 19 ± 19 | 21 ± 23 | 0.64 |
| Mild disease (n = 116) | Severe disease (n = 136) | P value | |
|---|---|---|---|
| All values are shown as mean ± SD or proportion as appropriate. Comparison by two-tailed t-test or Chi-square test as appropriate. n: number. SD: standard deviation. *Perioperative with either antithymocyte globulin or alemtuzumab. **During the first post-operative year and hydrocortisone equivalent. ***Post-transplant treatment with pegylated interferon-α2b or pegylated interferon-α2a with ribavirin. | |||
| Corticosteroids | 107 (92%) | 121 (89%) | 0.38 |
| Anti-T cell antibody* | 10 (9%) | 27 (20%) | 0.012 |
| Mycophenolate mofetil | 29 (25%) | 33 (24%) | 0.89 |
| Sirolimus | 1 (1%) | 4 (3%) | 0.24 |
| Acute rejection | 33 (28%) | 60 (44%) | 0.01 |
| Acute rejection episodes | 0.4 ± 0.7 | 0.6 ± 0.8 | 0.034 |
| ACR: steroid boluses | 29 (25%) | 50 (37%) | 0.045 |
| Chronic rejection | 4 (3%) | 9 (7%) | 0.26 |
| Cumulative steroid dose (g)** | 154 ± 780 | 214 ± 781 | 0.54 |
| Cumulative tacrolimus dose (mg/year) | 467 ± 577 | 686 ± 996 | 0.038 |
| Interferon therapy*** | 79 (68%) | 99 (73%) | 0.41 |
| Interferon responders | 28 (24%) | 31 (23%) | 0.8 |
| Variables included | B ± SE | Odds ratio | 95% CI | P value |
|---|---|---|---|---|
| Logistic regression analysis. R2 = 0.07 (Hosmer & Lemeshow), 0.09 (Cox & Snell), 0.12 (Nagelkerke). Model χ2 =24.1, P < 0.001. B: coefficient of regression. SE: standard error; CI: confidence interval. | ||||
| Recipient age | -0.055 ± 0.02 | 0.95 | 0.91 - 0.98 | 0.007 |
| Female gender | 0.96 ± 0.34 | 2.6 | 1.33 - 5.07 | 0.005 |
| Donor age | 0.02 ± 0.01 | 1.02 | 1.0 - 1.04 | 0.021 |
| Anti-T cell antibody | 0.85 ± 0.41 | 0.43 | 0.19 - 0.95 | 0.037 |
| Constant | 2.7 ± 1.12 | 14.88 | 0.016 | |
| Variable | B ± SE | Hazard ratio | P value |
|---|---|---|---|
| Cox proportional hazards analysis. B: coefficient of regression. SE: standard error. | |||
| Fibrosis stage 5/6 | 1.24 ± 0.51 | 3.46 | 0.016 |
| Fibrosis stage 3/4 | 0.81 ± 0.32 | 2.25 | 0.011 |
| Fibrosis stage 2 | 0.54 ± 0.36 | 1.71 | 0.133 |
| Recipient age | 0.01 ± 0.02 | 1.01 | 0.649 |
| Female gender | -0.13 ± 0.32 | 0.88 | 0.690 |
| Donor age | 0.03 ± 0.01 | 1.03 | 0.0007 |
| Anti-T cell antibody | 0.32 ± 0.30 | 1.38 | 0.285 |
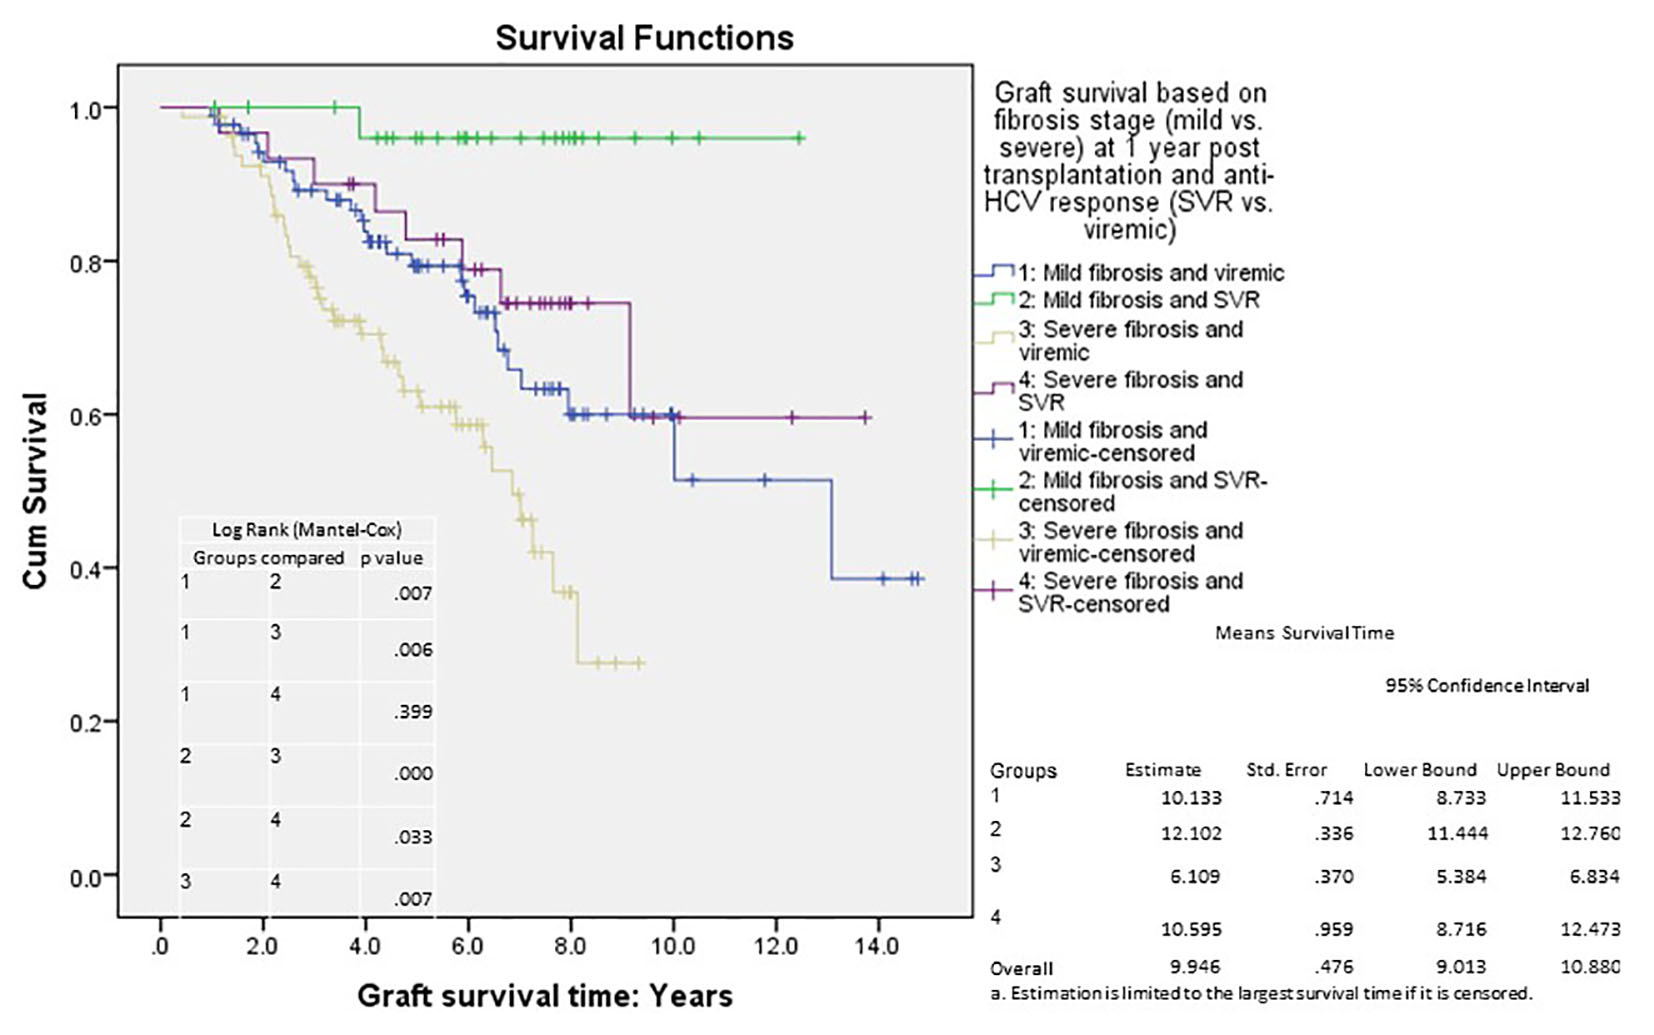
| P value | HR | 95.0% CI HR | ||
|---|---|---|---|---|
| Lower | Upper | |||
| CI: confidence interval; HR: hazard ratio. | ||||
| Mild disease viremic | 0.001 | |||
| Mild disease SVR | 0.026 | 0.103 | 0.014 | 0.761 |
| Severe disease viremic | 0.007 | 2.050 | 1.218 | 3.451 |
| Severe disease SVR | 0.419 | 0.721 | 0.326 | 1.594 |