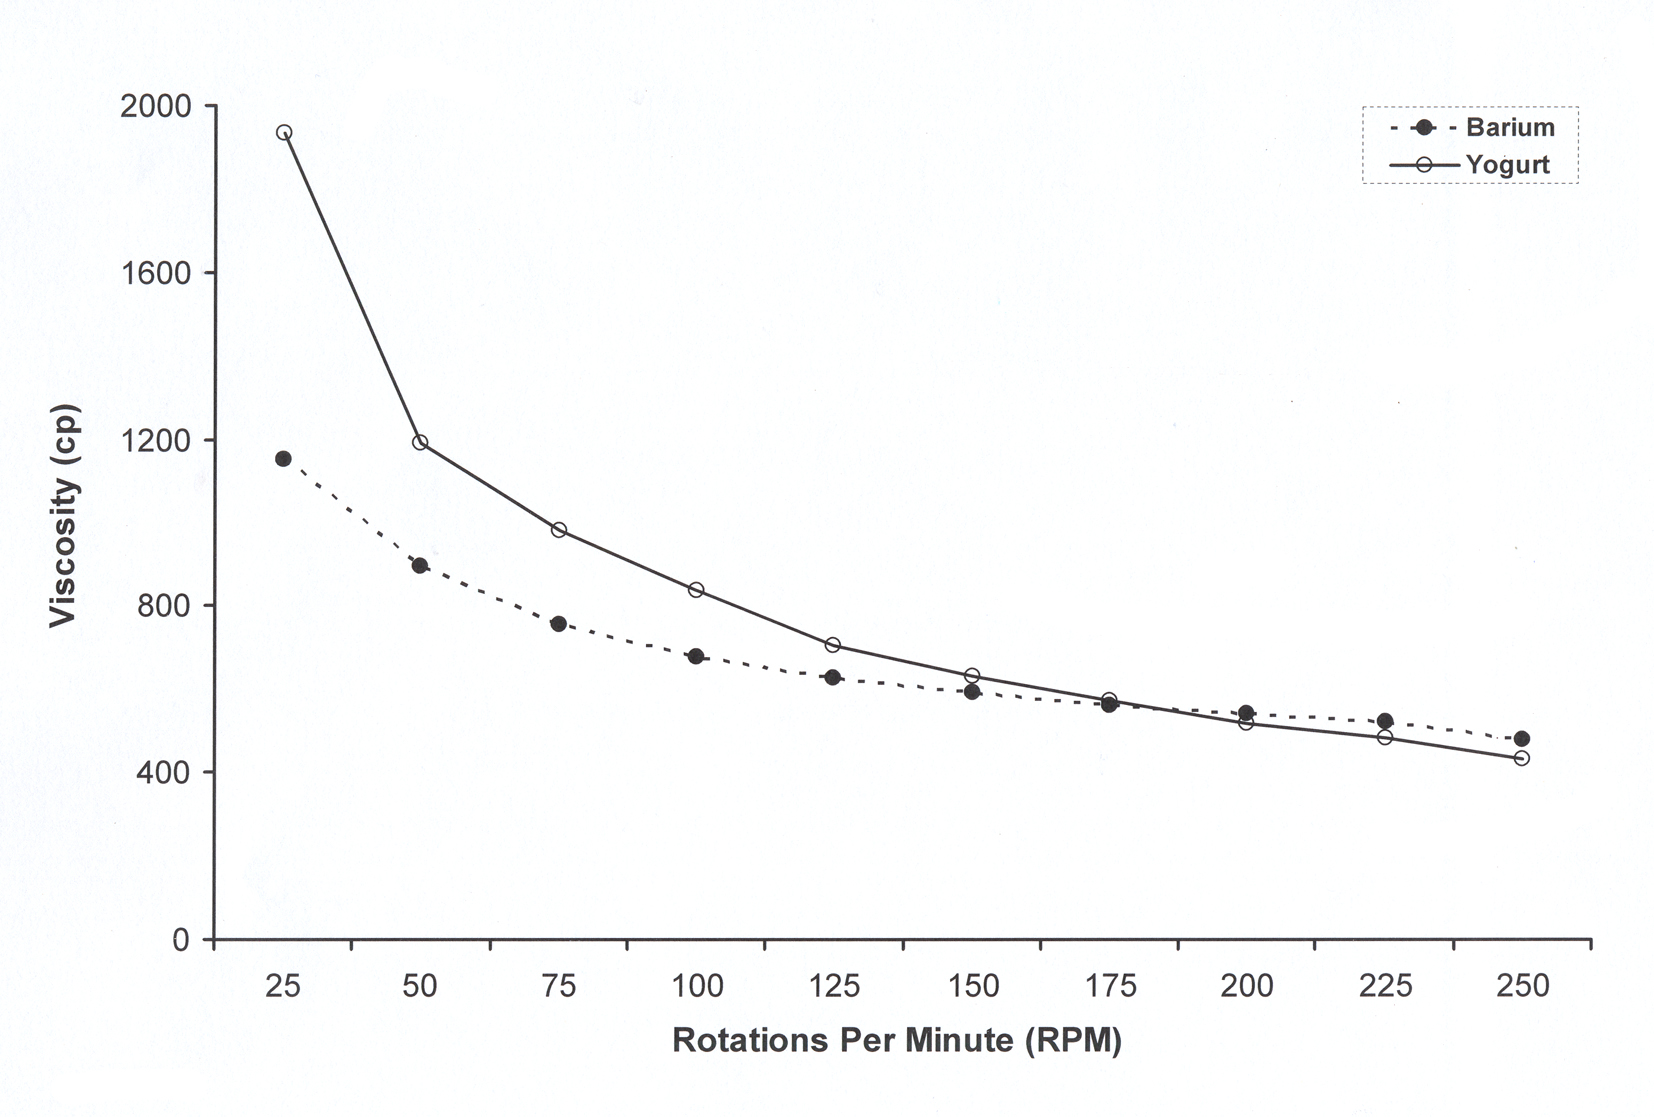
Figure 1. Measurement of viscosity, in centipoise (cp), of the barium and the yogurt, with the spindle rotation from 25 to 250 rotations per minute.
| Gastroenterology Research, ISSN 1918-2805 print, 1918-2813 online, Open Access |
| Article copyright, the authors; Journal compilation copyright, Gastroenterol Res and Elmer Press Inc |
| Journal website http://www.gastrores.org |
Original Article
Volume 8, Number 5, October 2015, pages 274-278
Esophageal Transit, Contraction and Perception of Transit After Swallows of Two Viscous Boluses
Figure
Tables
| Sitting, mean (SD) | Supine, mean (SD) | |||||
|---|---|---|---|---|---|---|
| 20 - 15 cm | 15 - 10 cm | 10 - 5 cm | 20 - 15 cm | 15 - 10 cm | 10 - 5 cm | |
| *P < 0.04 vs. barium. | ||||||
| BHAT | ||||||
| Yogurt | 0.9 (1.4)* | 2.0 (2.0)* | 2.1 (1.5)* | 1.0 (0.7)* | 1.9 (1.2) | 3.0 (2.7) |
| Barium | 0.5 (0.5) | 1.1 (1.2) | 1.2 (0.7) | 0.8 (1.2) | 1.4 (0.6) | 2.5 (1.4) |
| STT | ||||||
| Yogurt | 5.9 (3.2) | 5.2 (2.8) | 5.2 (1.7) | 6.0 (2.8)* | 6.1 (2.7) | 6.6 (2.4) |
| Barium | 5.1 (2.7) | 5.4 (2.8) | 5.7 (2.9) | 4.8 (2.5) | 5.9 (1.6) | 6.2 (1.0) |
| Sitting, mean (SD) | Supine, mean (SD) | |||
|---|---|---|---|---|
| Yogurt | Barium | Yogurt | Barium | |
| *P < 0.01 vs. barium. | ||||
| Amplitude | ||||
| 20 cm | 70.1 (40.1) | 64.9 (36.0) | 81.8 (37.9) | 87.6 (37.9) |
| 15 cm | 43.7 (29.3) | 41.0 (28.3) | 60.9 (41.4) | 65.0 (42.3) |
| 10 cm | 73.6 (44.7) | 69.3 (42.5) | 95.2 (60.1) | 101.7(53.1) |
| 5 cm | 107.8 (55.4) | 98.3 (57.6) | 110.2 (63.2)* | 130.7 (69.4) |
| Duration | ||||
| 20 cm | 2.4 (1.0) | 2.3 (0.8) | 2.8 (1.3) | 2.8 (1.2) |
| 15 cm | 2.4 (0.8) | 2.4 (1.0) | 2.9 (1.1) | 2.8 (0.9) |
| 10 cm | 2.9 (1.2) | 2.7 (1.0) | 3.0 (1.3) | 3.3 (1.3) |
| 5 cm | 3.1 (1.4) | 3.3 (1.5) | 3.5 (1.3) | 3.7 (1.6) |
| AUC | ||||
| 20 cm | 100.6 (67.6) | 87.7 (52.1) | 150.8 (107.0) | 149.8 (91.5) |
| 15 cm | 69.2 (52.8) | 70.4 (57.6) | 112.1 (80.9) | 118.9 (87.0) |
| 10 cm | 130.2 (85.6) | 118.8 (89.0) | 182.4 (145.1) | 202.6 (149.1) |
| 5 cm | 205.6 (173.1) | 216.2 (210.0) | 237.0 (189.6) | 294.0 (267.0) |
| Sitting | Supine | |||||||
|---|---|---|---|---|---|---|---|---|
| Yes | No | Yes | No | |||||
| N | % | N | % | N | % | N | % | |
| *P = 0.06 vs. barium. **P = 0.03 vs. barium. | ||||||||
| Yogurt | 19* | 36.5 | 33 | 63.5 | 11** | 21.2 | 41 | 78.8 |
| Barium | 9 | 17.3 | 43 | 82.7 | 5 | 9.6 | 47 | 90.4 |
| Sitting | Supine | |||||||
|---|---|---|---|---|---|---|---|---|
| Yes | No | Yes | No | |||||
| N | % | N | % | N | % | N | % | |
| *P = 0.06 vs. barium. | ||||||||
| Yogurt | 18 | 39.6 | 34 | 65.4 | 15* | 28.8 | 37 | 71.2 |
| Barium | 12 | 23.1 | 40 | 76.9 | 9 | 14.3 | 43 | 82.7 |