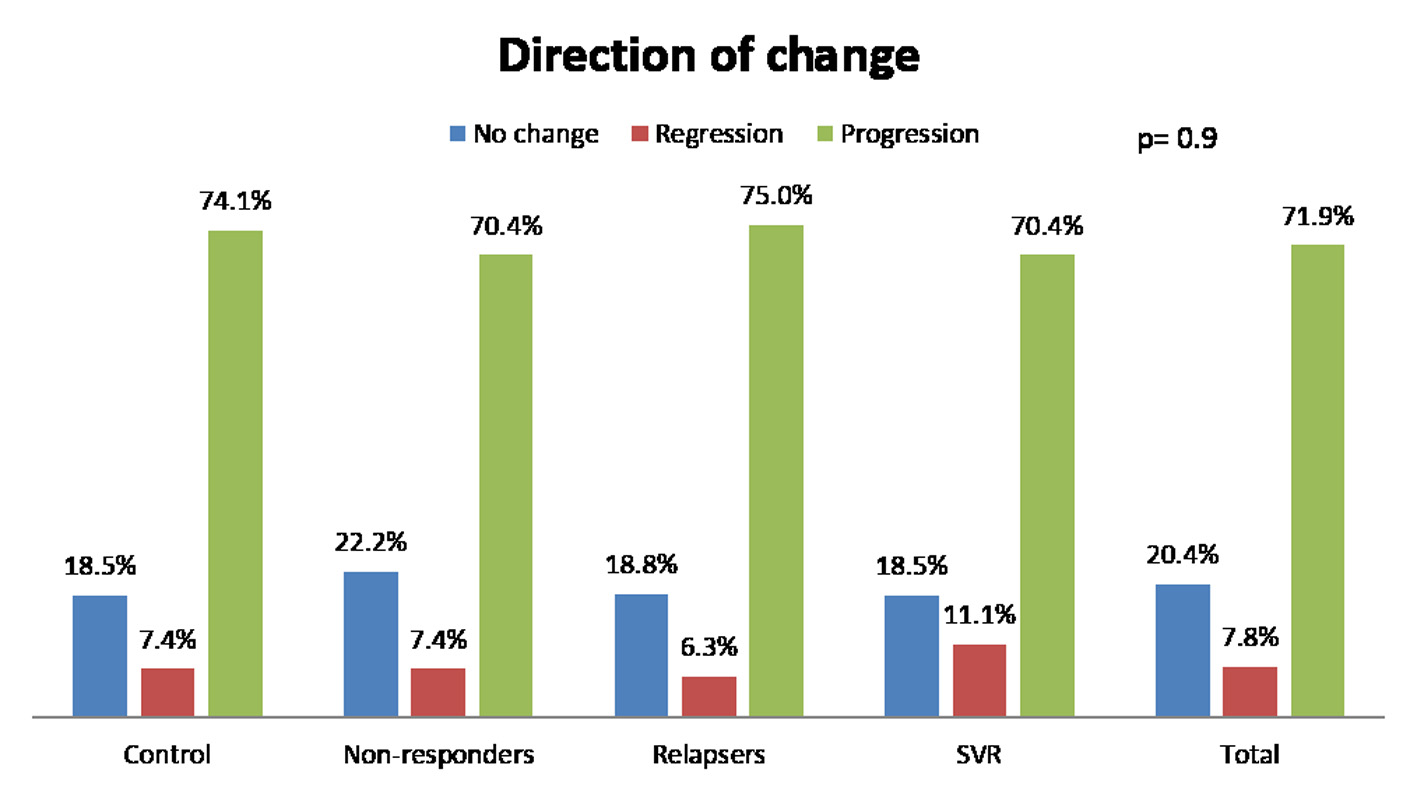
Figure 1. Change of fibrosis in patients. SVR: sustained virological response.
| Gastroenterology Research, ISSN 1918-2805 print, 1918-2813 online, Open Access |
| Article copyright, the authors; Journal compilation copyright, Gastroenterol Res and Elmer Press Inc |
| Journal website http://www.gastrores.org |
Original Article
Volume 8, Number 5, October 2015, pages 237-246
Slower Fibrosis Progression Among Liver Transplant Recipients With Sustained Virological Response After Hepatitis C Treatment
Figures
Tables
| Author | Year | Country | N | Study design | CG | FU | Pre-treatment fibrosis | Effect on fibrosis: SVR | Effect on fibrosis: NR | Effect on fibrosis: control | P value |
|---|---|---|---|---|---|---|---|---|---|---|---|
| N: number of patients; NS: not significant; *: number of patients evaluated histologically; CG: control group; NR: non-responders; SVR: sustained virological response; FU: follow-up. | |||||||||||
| Tame et al [15] | 2013 | Italy | 35* | Prospective | N | 40 | Metavir 2/4 | (n = 9) 32% improved, 68% unchanged, 0% worsened | (n = 19) 38% improved, 66% unchanged, 16% worsened | (n = 7) 70% improved, 50% unchanged, 50% worsened | 0.05 |
| Belli et al [12] | 2012 | Italy | 69* | RCT | Y | 36 | Ishaq-Knodell ≤ 3/6 | (n = 15) 20% worsening | (n = 21) 47.6% worsening | (n = 36) 50% worsening | 0.04 |
| Carrion et al [16] | 2007 | Spain | 81 | RCT | Y | 6 | Metavir 2/4 | (n = 18) 50% improved, 50% stable, 0% worse | (n = 36) 6% improved, 36% stable, 58% worse | (n = 27) 4% improved, 26% stable, 70% worse | 0.009 |
| Bizollon et al [13] | 2007 | France | 25* | Prospective | Y | 6 | Unknown | (n = 8) 100% improved, 0% stable, 0% worse | (n = 17) 65% improved, 35% stable, 0% worse | (n = 21) 5% improved, 19% stable, 76% worse | Significant; P value not presented |
| Oton et al [17] | 2006 | Spain | 15* | Retrospective | N | 6 | Ishaq-Knodell ≥ 1/6 | (n = 7) mean score pre-treatment: 2.4/6, mean score post-treatment: 2.6/6 | (n = 8) mean score pre-treatment: 2.7/6, mean score post-treatment: 3.7/6 | NS | |
| Fernandez et al [18] | 2006 | Spain | 16* | Prospective | N | 6 | Scheuer Fibrosis score | (n = 7) mean score pre-treatment: 1.5/4, mean score post-treatment: 1.1/4 | (n = 9) mean score pre-treatment: 2.4/6, mean score post-treatment: 2.8/6 | NS | |
| Barenguer et al [19] | 2009 | Spain | 47* | Retrospective | N | 12 | HAI fibrosis stage 0 - 4 | No change and improvement 46% | No change and improvement 44% | NS | |
| Stravitz et al [21] | 2004 | USA | 23 | Retrospective | N | 23 | (n = 11) mean score pre-treatment: 1.9/4, mean score post-treatment: 1.5/4 | (n = 12) mean score pre-treatment: 2.5/4, mean score post-treatment: 2.7/4 | NS | ||
| Abdelmalek et al [20] | 2004 | USA | 26* | Retrospective | N | 24 - 60 | Not known | At year 2 FU, 27% improved, 38% unchanged, 35% worsened, At year 3-5 FU, 67% improved, 13% unchanged, 20% worsened. | 0.05 | ||
| Bahra et al [14] | 2007 | Germany | 28 | Prospective | N | 36 | 1.8 | (n = 28) 18% improved, 60% unchanged, 21% worsened. Mean fibrosis stage at 1, 3 and 5 years: 2.0, 2.1 and 1.4 respectively. | NS | ||
| Features | Study cohort (n = 167) | Control group (n = 27) | Treatment group (n = 140) | P value |
|---|---|---|---|---|
| n: number of patients; NHBD: non-heart beating donor; MELD: model for end-stage liver disease; CTP: Child-Turcotte-Pugh. | ||||
| Patient age, mean ± SD | 49.4 ± 7.7 | 48.6 ± 9.09 | 49.5 ± 7.4 | NS |
| Patient ≥ 65, % (n) | 2.4 (4) | 3.7 (1) | 2.1 (3) | NS |
| Gender male, % (n) | 78.4 (131) | 74.1 (20) | 79.3 (111) | NS |
| Race white, % (n) | 89.8 (150) | 88.9 (15) | 90 (126) | NS |
| Non-Hispanic, % | 95.8 (160) | 88.9 (24) | 90 (126) | NS |
| Donor age, mean ± SD | 40.6 ± 17.3 | 41.1 ± 18.8 | 40.5 ± 17.1 | NS |
| Donor age, % > 50 | 31.7 (53) | 29.6 (8) | 32.1 (45) | NS |
| Donor gender, % male | 55.7 (53) | 55.6 (15) | 55.7 (78) | NS |
| Donor ethnic, % white | 85 (142) | 81.5 (22) | 85.7 (120) | NS |
| Donor ethnic, % non-Hispanic | 83.8 (140) | 77.8 (21) | 85 (119) | NS |
| Donor NHBD, % (n) | 6.3 (4) | 00(00) | 7.7 (4) | NS |
| MELD score, mean ± SD | 16.4 ± 7.1 | 18.2 ± 7.9 | 16 ± 6.9 | NS |
| Child-Pugh score, mean ± SD | 7.8 ± 1.58 | 7.9 ± 1.5 | 7.8 ± 1.5 | NS |
| Cold ischemia time, h ± SD | 11.5 ± 3.5 | 12.9 ± 3.9 | 11.3 ± 3.4 | NS |
| Warm ischemia time, min ± SD | 34.8 ± 21.1 | 28.5 ± 24.0 | 36 ± 20.4 | NS |
| Induction therapy, % (n) | 16.8 (28) | 14.8 (4) | 17.1 (24) | NS |
| Received steroids, % (n) | 81.6 (129) | 87 (20) | 80.7 (109) | NS |
| Clinical features | Control (n = 27) | Treatment (n = 140) | P value | ||
|---|---|---|---|---|---|
| Mean | SD | Mean | SD | ||
| SD: standard deviation; ALT; alanine aminotransferase; AST: aspartate aminotransferase; ALP: alkaline phosphatase; MHAI: modified histologic activity index. | |||||
| Bilirubin pre-treatment, mg/dL | 0.91 | 0.61 | 1.29 | 1.92 | NS |
| Bilirubin at initiation, mg/dL | 2.86 | 6.07 | 1.61 | 3.47 | NS |
| Bilirubin at follow-up, mg/dL | 5.49 | 9.14 | 3.77 | 8.53 | NS |
| ALT pre-treatment, IU/dL | 121.56 | 122.84 | 96.89 | 103.40 | NS |
| AST pre-treatment, IU/dL | 99.11 | 115.61 | 90.09 | 130.42 | NS |
| AST/ALT pre-treatment | 0.89 | 0.51 | 0.92 | 0.42 | NS |
| ALP pre-treatment, IU/dL | 275.73 | 311.36 | 171.11 | 190.02 | NS |
| Cholestasis index | 2.29 | 2.46 | 2.21 | 1.95 | NS |
| Creatinine pre-treatment, mg/dL | 1.35 | 0.51 | 1.26 | 0.42 | NS |
| Time from transplant to pre-treatment biopsy, years | 0.99 | 1.46 | 0.90 | 1.05 | NS |
| MHAI grade 0 - 18 pre-treatment | 5.20 | 1.86 | 4.93 | 2.78 | NS |
| Fibrosis stage 0 - 6 pre-treatment | 1.11 | 1.31 | 1.34 | 1.46 | NS |
| Time from transplant to treatment, years | 0.98 | 1.06 | NS | ||
| Treatment duration, years | 1.62 | 1.16 | NS | ||
| Time from transplant to follow-up biopsy, years | 3.29 | 2.31 | 3.97 | 2.89 | NS |
| Control group | Non-responders | Relapsers | SVR | P value | |
|---|---|---|---|---|---|
| LT: liver transplantation. | |||||
| Time interval between LT and initiation of treatment, years | 0.89 | 1.17 | 1.01 | NS | |
| Time interval between LT and first liver biopsy, years | 1.03 | 0.81 | 1.06 | 0.96 | NS |
| Time interval between LT and second liver biopsy, years | 3.40 | 4.12 | 3.47 | 2.92 | NS |
| Time interval between first and second liver biopsy, years | 2.37 | 3.32 | 2.40 | 3.00 | Ns |
| Mean fibrosis change between two biopsies | 2.04 | 2.11 | 1.57 | 1.37 | 0.08 |
| Mean fibrosis stage change per year | 1.02 | 0.63 | 0.65 | 0.45 | 0.08 |
| Direction of change in fibrosis | NS | ||||
| Regression, % (n) | 7.4 (2) | 7.4 (6) | 6.2 (2) | 11.1 (3) | |
| No change, % (n) | 18.5 (5) | 22.2 (18) | 18.8 (6) | 18.5 (5) | |
| Progression, % (n) | 74.1 (20) | 70.4 (57) | 75 (24) | 70.4 (19) | |