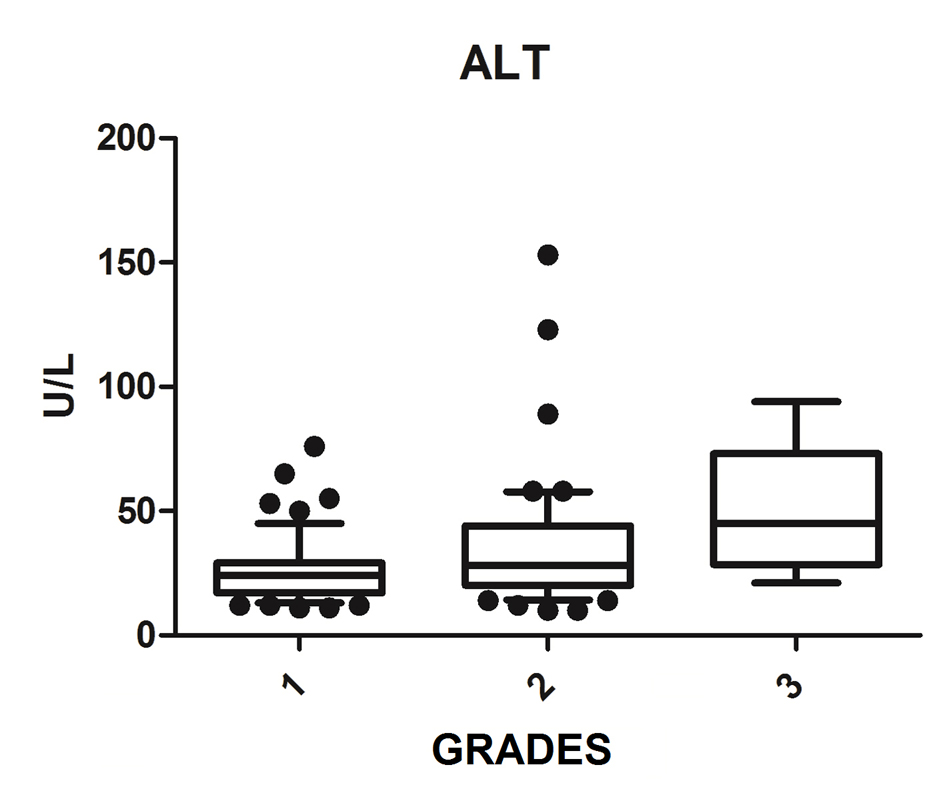
Figure 1. ALT vs. hepatic steatosis. ALT: alanine transferase; P: significance.
| Gastroenterology Research, ISSN 1918-2805 print, 1918-2813 online, Open Access |
| Article copyright, the authors; Journal compilation copyright, Gastroenterol Res and Elmer Press Inc |
| Journal website http://www.gastrores.org |
Original Article
Volume 8, Number 5, October 2015, pages 260-264
Association of the Nonalcoholic Hepatic Steatosis and Its Degrees With the Values of Liver Enzymes and Homeostasis Model Assessment-Insulin Resistance Index
Figures
Table
| Nonalcoholic hepatic steatosis | P | ||||||
|---|---|---|---|---|---|---|---|
| Grade 1 | Grade 2 | Grade 3 | |||||
| Median (quartile) | n | Median (quartile) | n | Median (quartile) | n | ||
| BMI: body mass index; GGT: gamma-glutamyl transpeptidase; AST: aspartate aminotransferase; ALT: alanine transferase; HOMA-IR: homeostasis model assessment-insulin resistance; n: number of patients; P: significance. | |||||||
| Age (n = 233) | 44.0 (37.0 - 51.0) | 119 | 47.5 (40.0 - 53.0) | 94 | 45.5 (36.5 - 54.8) | 20 | 0.107 |
| BMI (n = 125) | 29.5 (26.5 - 32.4) | 64 | 30.4 (27.9 - 35.2) | 54 | 33.6 (29.2 - 45.2) | 7 | 0.129 |
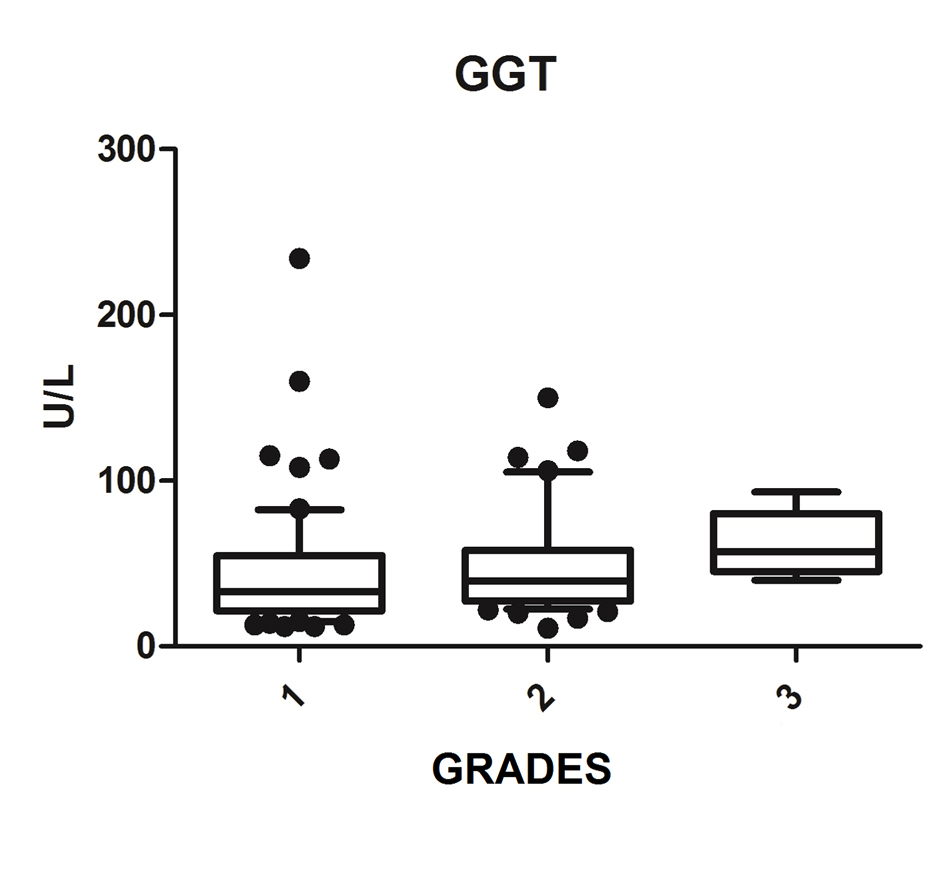
| GGT (n = 127) | 34.0 (21.5 - 55.5) | 65 | 39.5 (28.5 - 62.0) | 56 | 57.0 (42.2 - 80.2) | 6 | 0.034 |
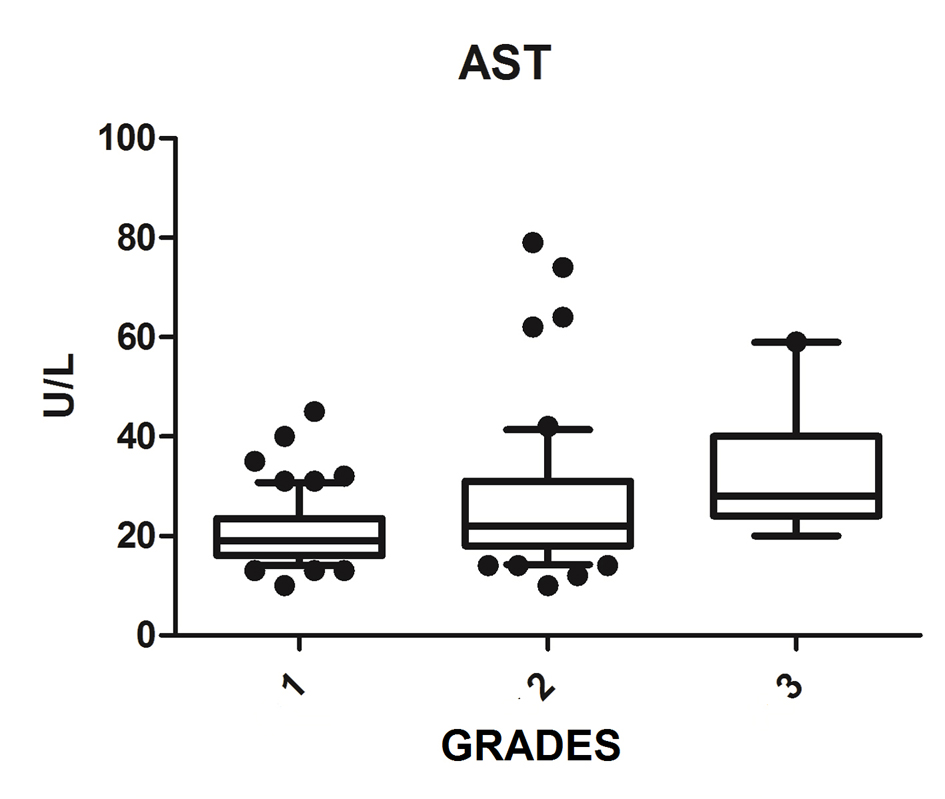
| AST (n = 135) | 19.0 (16.0 - 23.0) | 68 | 23.0 (18.0 - 31.2) | 58 | 28.0 (24.0 - 40.0) | 9 | 0.0001 |
| ALT (n = 136) | 24.0 (17.0 - 28.5) | 69 | 29.5 (20.7 - 44.0) | 58 | 45.0 (28.5 - 73.0) | 9 | 0.001 |
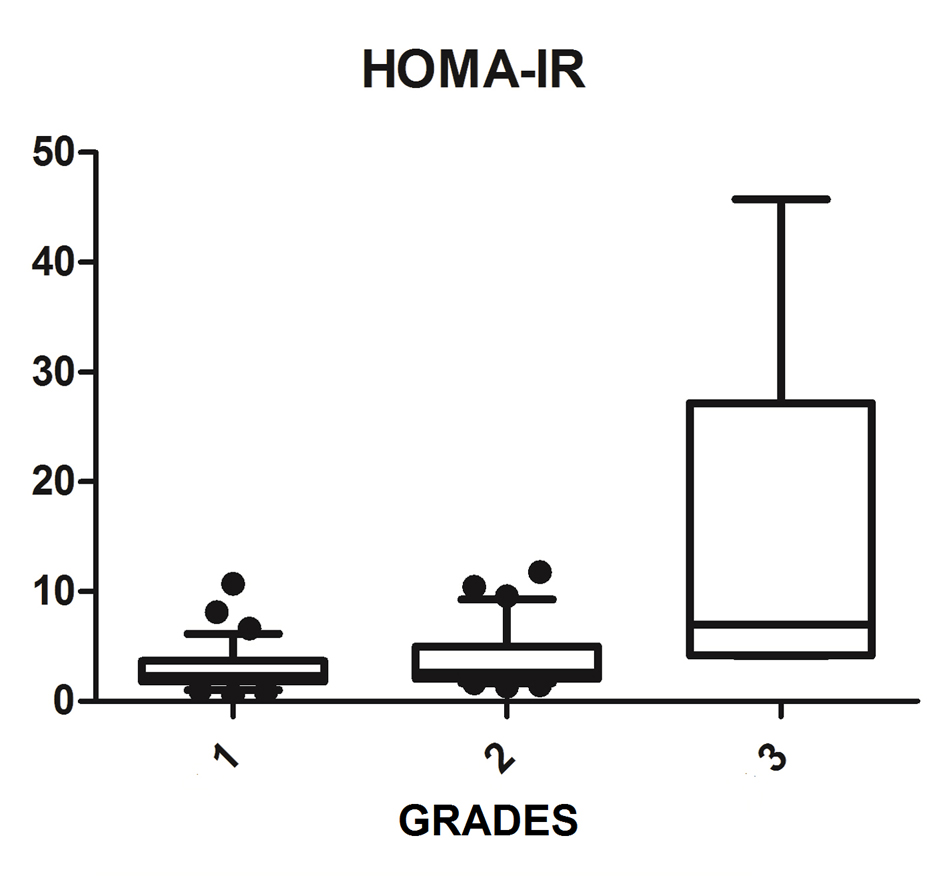
| HOMA-IR (n = 75) | 2.34 (1.88 - 3.58) | 36 | 2.62 (2.04 - 5.23) | 34 | 6.98 (4.2 - 27.2) | 5 | 0.008 |