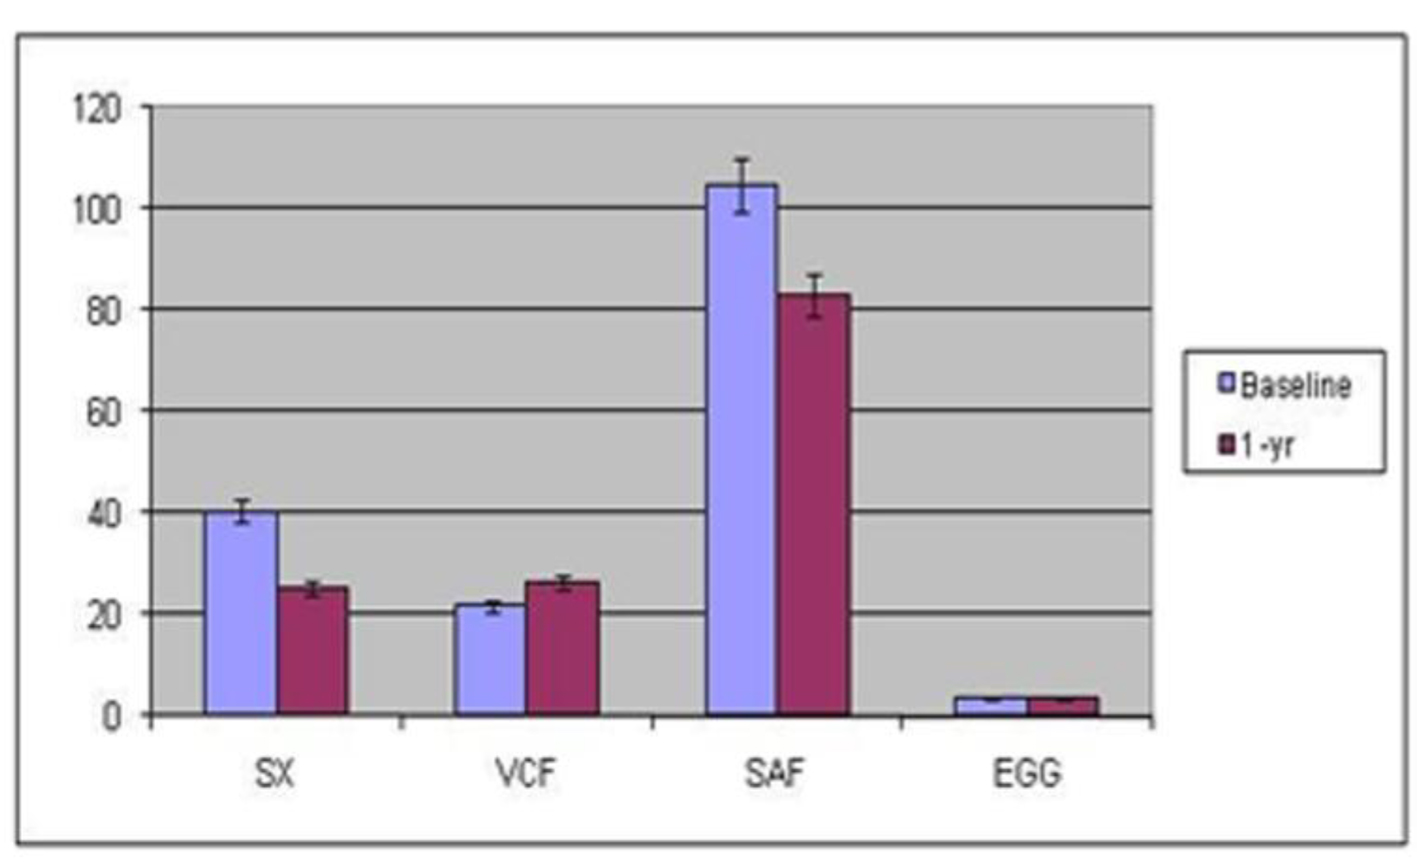
Figure 1. Symptoms, autonomic and enteric measures at baseline and 1 year after gastric stimulation at center one. EGG: electrogastrography; Gp: gastroparesis; SAF: sympathetic adrenergic function; VCF: vagal cholinergic function.
| Gastroenterology Research, ISSN 1918-2805 print, 1918-2813 online, Open Access |
| Article copyright, the authors; Journal compilation copyright, Gastroenterol Res and Elmer Press Inc |
| Journal website http://www.gastrores.org |
Original Article
Volume 9, Number 1, February 2016, pages 10-16
Autonomic Evaluation of Patients With Gastroparesis and Neurostimulation: Comparisons of Direct/Systemic and Indirect/Cardiac Measures
Figures
Tables
| Group 1: 39 patients | Baseline | Follow-up | P-value |
|---|---|---|---|
| Gastroparesis (Gp) symptoms | 40.5 ± 1.8 | 25.4 ± 2.9 | < 0.001 |
| Cardio-vagal function (VCF) | 21.9 ± 2.3 | 26.2 ± 3.4 | 0.15 |
| Sympathetic-adrenergic function (SAF) | 104.7 ± 5.7 | 82.9 ± 8.4 | < 0.05 |
| Electrogastrography (EGG) | 3.8 ± 0.2 cpm | 3.6 ± 0.1 cpm | 0.3 |
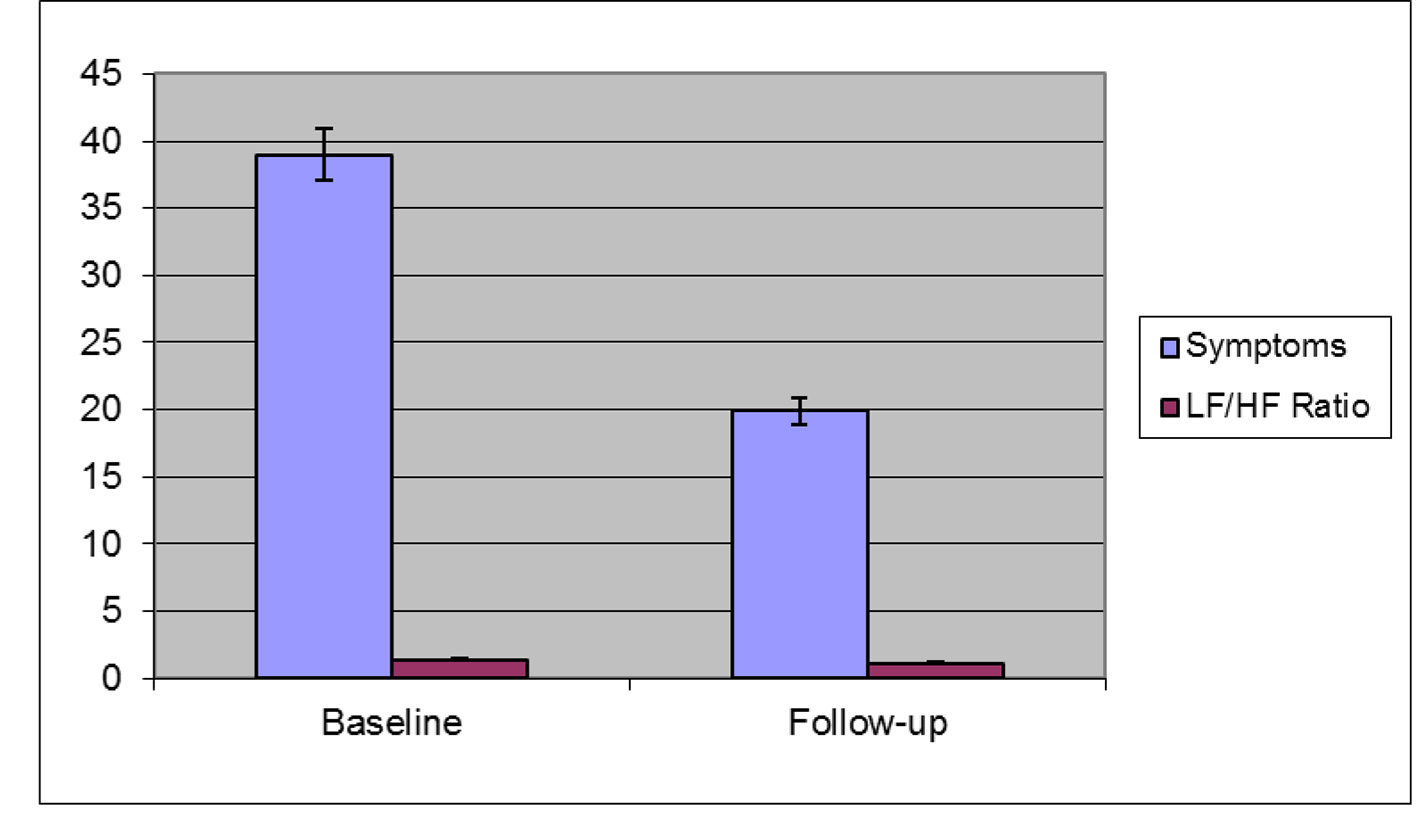
| Group 2: 35 patients | Baseline | Follow-up | P-value |
|---|---|---|---|
| Symptoms | 39.0 ± 1.9 | 19.9 ± 3.7 | < 0.001 |
| Low to high frequency ratio | 1.4 ± 0.1 | 1.1 ± 0.07 | 0.1 |
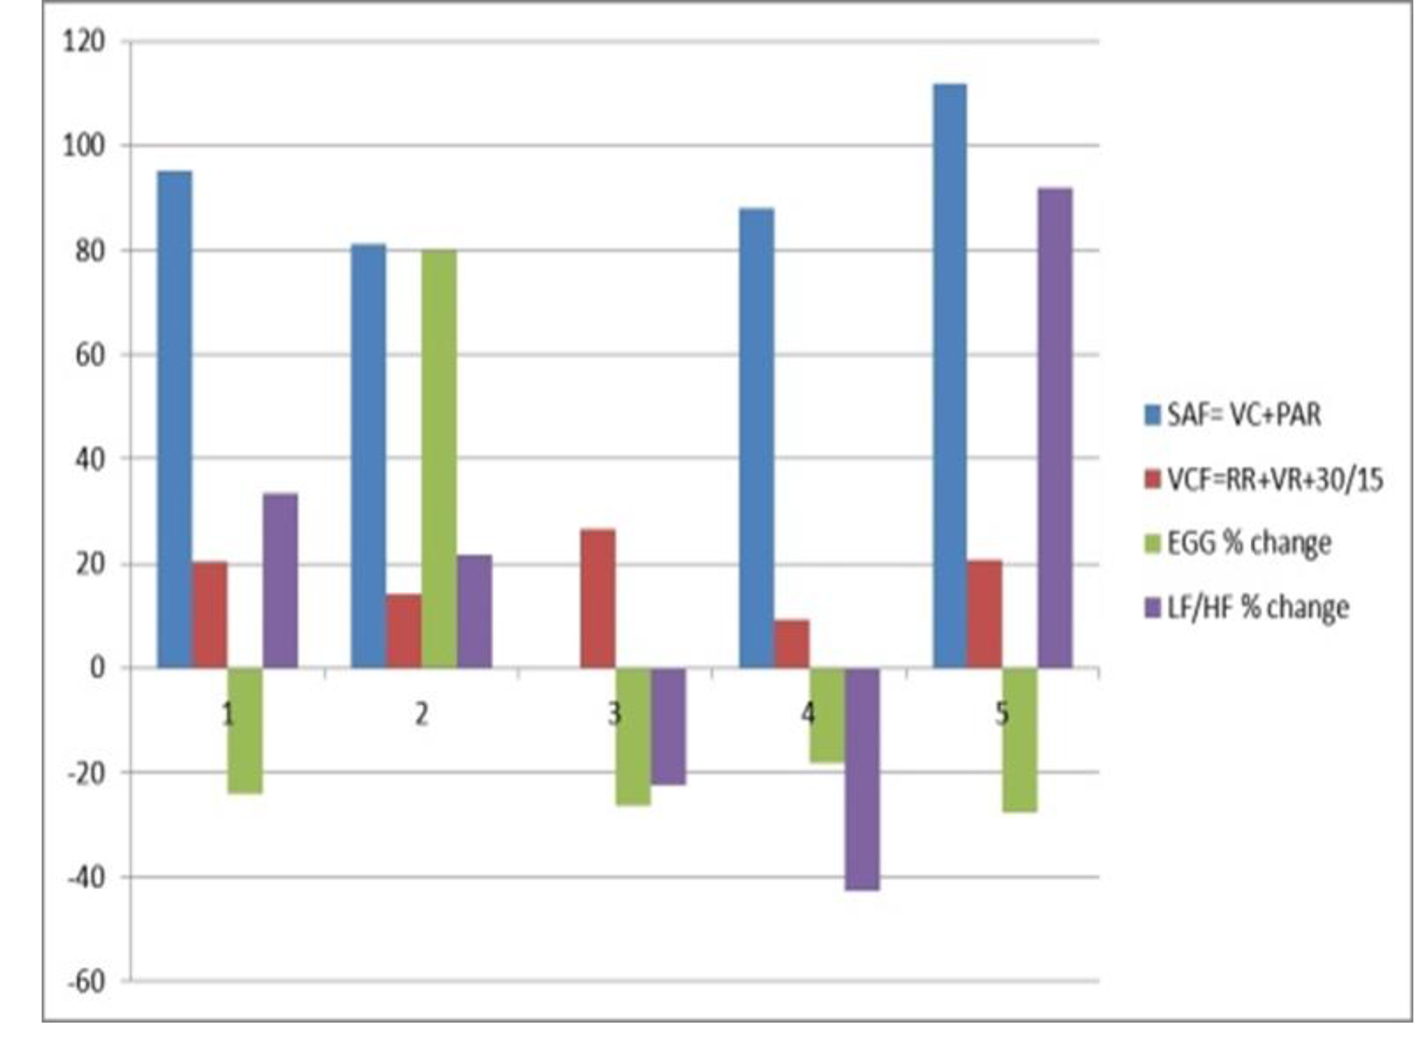
| Subject | HRV %Δ LF/HF with meal | HRV interpretation | SAF %VC | SAF PAR | Total SAF = VC + PAR | Total VCF = RR + VR + 30/15 | AFT interpretation | EGG %Δ in frequency with meal |
|---|---|---|---|---|---|---|---|---|
| AFT: autonomic nervous system testing; EGG: electrogastrography; Gp: gastroparesis; HF: cholinergic/high frequency; HRV: heart rate variability; LF: adrenergic/low-frequency; SAF: sympathetic adrenergic function; VCF: vagal cholinergic function. | ||||||||
| 1 | 33.33 | Sympathetic dominant | 92 | 3.3 | 95.30 | 20.23 | Normal parasympathetic/abnormal sympathetic (PAR) | -24.10 |
| 2 | 21.57 | Sympathetic dominant | 79 | 2.2 | 81.20 | 14.28 | Abnormal sympathetic (PAR) | 79.86 |
| 3 | -22.47 | Parasympathetic dominant | NA | 11 | NA | 26.41 | Abnormal sympathetic (PAR) | -26.37 |
| 4 | -42.62 | Parasympathetic dominant | 84.5 | 3.5 | 88.00 | 9.13 | Abnormal parasympathetic > abnormal sympathetic (PAR) | -18.37 |
| 5 | 92.00 | Sympathetic dominant | 98 | 14 | 112.00 | 20.61 | Normal parasympathetic/abnormal sympathetic (PAR) | -27.88 |