Gastroenterology Research, ISSN 1918-2805 print, 1918-2813 online, Open Access
Article copyright, the authors; Journal compilation copyright, Gastroenterol Res and Elmer Press Inc
Journal website http://www.gastrores.org

Original Article

Volume 8, Number 2, April 2015, pages 186-192


Gastrointestinal Hemorrhage Severity Triage: Locally Derived Score May Outperform Existing Scoring Systems

Figure

Figure 1.
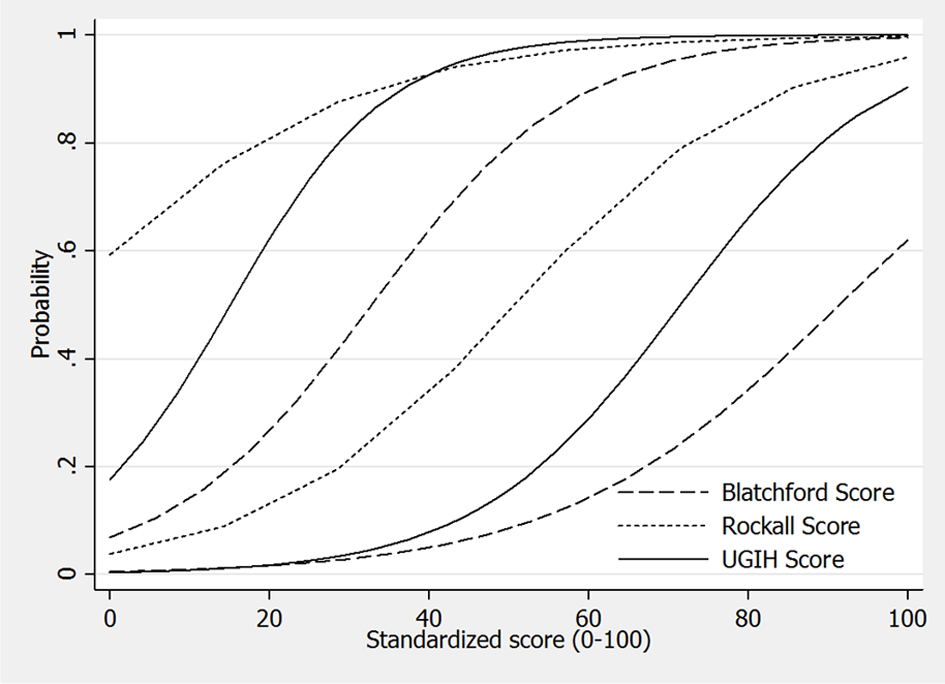
Figure 1. Discrimination of upper gastrointestinal hemorrhage patients into mild, moderate and severe, by the Blatchford score, the pre-endoscopic Rockall score, and the local UGIH score. Original scores were transformed into the same scaled standardized score from 0 to 100.

Tables

Table 1. Scoring Scheme for the Blatchford Score
 
Item indicatorsCategoriesScore
BUN (mg/dL)< 18.20
18.2 - 22.32
22.4 - 27.93
28 - 69.94
≥ 706
Hemoglobin (g/dL)Male> 130
12.0 - 12.91
10.0 - 11.93
< 10.06
Female> 120
10.0 - 11.91
< 10.06
Systolic blood pressure (mm Hg)≥ 1100
100 - 1091
90 - 992
< 903
Pulse rate (/min)< 1000
≥ 1001
MelenaYes1
No0
SyncopeYes2
No0
Hepatic diseasesYes2
No0
Cardiac failureYes2
No0


Table 2. Scoring Scheme for the Pre-Endoscopic Rockall Score
 
Item indicatorsCategoriesCriteriaScore
Age (years)< 600
60 - 791
≥ 802
ShockNo shockSBP > 100 mm Hg0
Pulse < 100/min
TachycardiaSBP > 100 mm Hg1
Pulse > 100/min
HypotensionSBP < 100 mm Hg2
ComorbidityNo major comorbidity0
Cardiac failure2
Ischemic heart disease
Any major comorbidity
Renal or liver failure3
Disseminated malignancy


Table 3. Scoring Scheme for the Local UGIH Score
 
Item indicatorsCategoriesScore
Age (years)≥ 601
< 600
Pulse (/min)≥ 1001
< 1000
Systolic blood pressure (mm Hg)< 10010.5
≥ 1000
Hemoglobin (g/dL)< 106
≥ 100
BUN (mg/dL)≥ 352
< 350
CirrhosisYes2
No0
Hepatic failureYes4.5
No0


Table 4. Characteristics of Patients With Upper Gastrointestinal Hemorrhage and Score Distributions
 
CharacteristicsUGIH severityP-value
Mild (mean ± SD)Moderate (mean ± SD)Severe (mean ± SD)
Demographic and presentations
  Age (years)53.0 ± 18.361.2 ± 14.558.7 ± 14.6< 0.001
  Hematemesis, n (%)164 (49.4)360 (42.5)113 (49.6)0.738
  Coffee ground vomiting, n (%)85 (25.6)140 (16.5)47 (20.6)0.054
Hematochezia, n (%)22 (6.6)53 (6.3)23 (10.1)0.168
  Melena, n (%)141 (42.5)531 (62.7)129 (56.6)< 0.001
  Syncope, n (%)39 (11.8)172 (20.3)54 (23.7)< 0.001
Vital signs and biochemicals
  Pulse (/min)90.2 ± 16.391.5 ± 15.793.2 ± 16.60.094
  Systolic blood pressure (mm Hg)129.6 ± 20.3123.8 ± 19.490.7 ± 15.8< 0.001
  Hemoglobin (g/dL)11.7 ± 2.46.9 ± 2.17.3 ± 2.6< 0.001
  BUN (mg/dL)23.4 ± 16.437.0 ± 22.138.5 ± 22.7< 0.001
Co-morbidity
  Cirrhosis, n (%)20 (6.0)123 (14.5)53 (23.2)< 0.001
  Hepatic failure, n (%)2 (0.6)8 (0.9)6 (2.6)0.038
  Cardiac failure, n (%)1 (0.3)6 (0.7)5 (2.2)0.024
  Renal failure, n (%)5 (1.5)82 (9.7)32 (14.0)< 0.001
Clinical outcomes
  Re-bleeding, n (%)7 (2.1)44 (5.19)27 (11.8)< 0.001
  Dead, n (%)0 (0)2 (0.24)38 (16.7)< 0.001
Score types
  The Blatchford score5.0 ± 3.810.3 ± 2.712.0 ± 2.7< 0.001
  The pre-endoscopic Rockall score0.7 ± 0.81.2 ± 1.22.7 ± 1.3< 0.001
  The local UGIH score3.3 ± 4.19.0 ± 4.216.7 ± 4.0< 0.001


Table 5. Discriminative and Diagnostic Indices of Bradford Score, Rockall Score and UGIH Score
 
IndicesScore typesP-value
Bradford
score1
Rockall
score2
UGIH
score3
3 vs. 13 vs. 2
Discrimination: AuROC (%)
  Mild vs. rest87.370.086.80.693< 0.001
  Severe vs. rest74.686.190.5< 0.001< 0.001
Diagnostic
  Sensitivity (%)
    Mild vs. rest96.810095.70.125< 0.001
    Severe vs. rest9.216.262.3< 0.001< 0.001
  Specificity (%)
    Mild vs. rest59.0068.7< 0.001< 0.001
    Severe vs. rest99.794.192.0< 0.0010.029
  PPV (%)
    Mild vs. rest88.476.490.80.037< 0.001
    Severe vs. rest84.034.960.2< 0.001< 0.001
  NPV (%)
    Mild vs. rest85.2-83.20.146-
    Severe vs. rest85.085.392.7< 0.001< 0.001
  Correctly classified (%)
    Mild vs. rest87.976.489.30.243< 0.001
    Severe vs. rest85.081.287.20.092< 0.001