Gastroenterology Research, ISSN 1918-2805 print, 1918-2813 online, Open Access
Article copyright, the authors; Journal compilation copyright, Gastroenterol Res and Elmer Press Inc
Journal website http://www.gastrores.org

Original Article

Volume 8, Number 2, April 2015, pages 178-185


Can IgG4 Levels Identify the Ulcerative Colitis Subtype of Inflammatory Bowel Disease?

Figures

Figure 1.
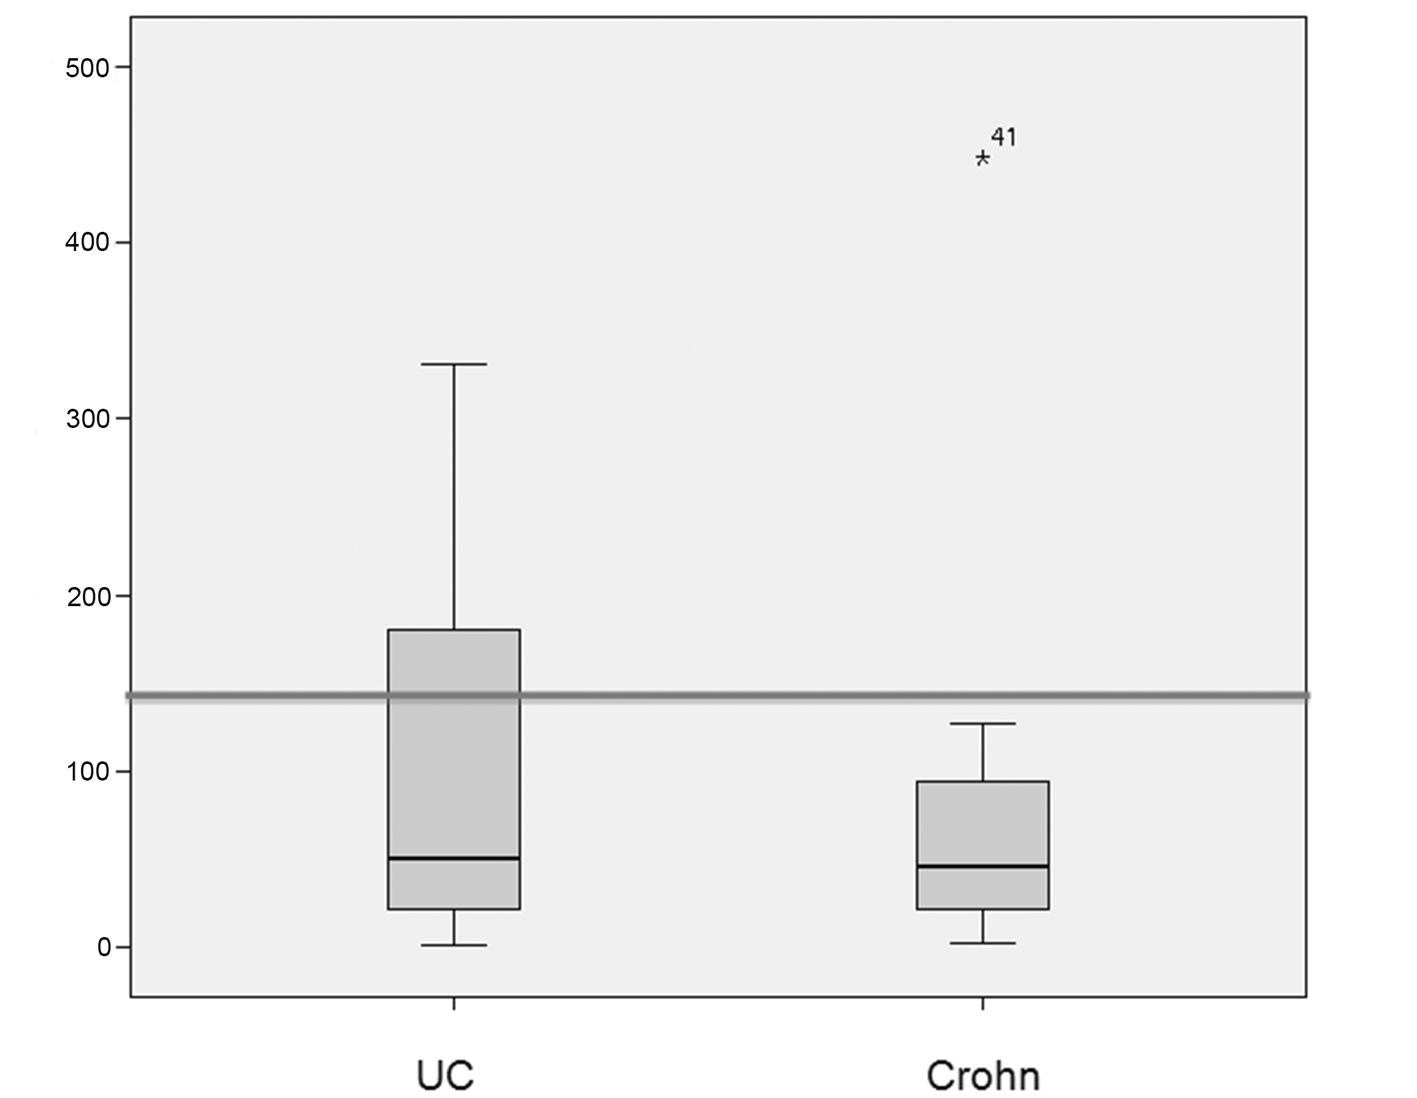
Figure 1. Box plots showing the distribution of IgG4 levels (in mg/dL) in patients with ulcerative colitis (UC) and Crohn’s disease (CD). The median IgG4 level was 50 mg/dL in the UC group and 46 mg/dL in the CD group. IgG4 levels > 140 mg/dL were significantly more prevalent in patients with UC (P = 0.0006). The line represents the 140 mg/dL cutoff.
Figure 2.
Figure 2. Box plots showing the distribution of fecal pancreatic elastase levels (in μg/g of stool) in patients with ulcerative colitis (UC) and Crohn’s disease (CD). The median elastase level was 391 μg/g in the UC group and 301 μg/g in the CD group. There was no significant between-group difference in the prevalence of levels < 200 μg/g (P = 0.7).
Figure 3.
Figure 3. Flowchart of patients with inflammatory bowel disease and abnormal laboratory findings (IgG4/elastase) among those for whom immunohistochemical assessment of tissue IgG4 levels was available. N: number of patients; HPF: high-power field.

Tables

Table 1. Clinical and Epidemiologic Profile of Patients With Inflammatory Bowel Disease (n = 56)
 
VariableUCa (n = 30)CDb (n = 26)Overall (n = 56)
aUlcerative colitis. bCrohn’s disease. cMean (standard deviation). dNumber of patients with fecal elastase level < 200 μg/g of stool. eNumber of patients with serum IgG4 level > 140 mg/dL. fNumber of patients with active disease as defined by the Lichtiger clinical-activity index (UC) or the Crohn’s disease activity index (CD).
Females191635
Age (years)c42 (14)44 (15)43 (14)
Reduced fecal elastased5510
Elevated serum IgG4e9110
Active diseasef14822
Extraintestinal manifestations303
Time elapsed since diagnosis (months)c67 (71)69 (46)68 (61)


Table 2. Extent (Location and Behavior) of Crohn’s Disease According to the Montreal Classification (n = 26)
 
Variablen
aGastrointestinal.
Location
  Ileal6
  Colonic19
  Ileocolonic1
  Upper GIa tract0
  Perianal0
Behavior
  Non-stricturing, non-penetrating14
  Stricturing6
  Penetrating6


Table 3. Association Between Sociodemographic and Clinical Variables and Serum IgG4 > 140 mg/dL in Patients With Inflammatory Bowel Disease and Prevalence Ratios After Multiple Poisson Regression
 
n (%)Prevalence, n (%)95% CIPRa95% CIbP-value
aPrevalence ratio (multiple Poisson regression). b95% confidence interval, corrected (multiple Poisson regression). cUlcerative colitis. dCrohn’s disease.
Sex
  Male21 (37%)6 (28.57%)8.64 - 48.511.00
  Female35 (63%)4 (11.43%)0.55 - 22.31.890.63 - 5.630.2000
Disease
  UCc30 (53.5%)9 (30%)13.08 - 46.9216.423.32 - 79.580.0006
  CDd26 (46.4%)1 (3.85%)0.00 - 11.471.00
Activity
  Remission37 (66%)6 (16.22%)3.96 - 28.471.010.31 - 3.350.9000
  Active19 (33%)4 (21.05%)2.14 - 39.971.00
Elastase
  > 200 μg/g46 (82.2%)8 (17.39%)6.09 - 28.691.00
  < 200 μg/g10 (17.8%)2 (20.0%)0.00 - 45.580.740.18 - 3.020.7000
Azathioprine
  No23 (41%)3 (13.04%)0.00 - 27.741
  Yes33 (59%)7 (21.21%)6.82 - 35.64.81.32 - 17.390.0017
Corticosteroids
  No25 (40%)5 (20%)3.82 - 36.183.861.01 - 14.650.0470
  Yes31 (60%)5 (16%)2.77 - 29.491


Table 4. Association Between Sociodemographic and Clinical Variables and Fecal Elastase < 200 μg/g in Patients With Inflammatory Bowel Disease and Prevalence Ratios After Multiple Poisson Regression
 
n (%)Prevalence, n (%)95% CIPRa95% CIbP-value
aPrevalence ratio (multiple Poisson regression). b95% confidence interval, corrected (multiple Poisson regression). cUlcerative colitis. dCrohn’s disease.
Sex
  Male21 (37%)4 (19%)1.72 - 36.381.260.39 - 4.060.7000
  Female35 (63%)6 (17%)4.26 - 30.021.00
Disease
  UCc30 (53.5%)5 (16.67%)2.91 - 30.431.00
  CDd26 (46.4%)5 (19.23%)3.60 - 34.861.250.22 - 7.190.8000
Activity
  Remission37 (66%)7 (18.92%)5.9 - 31.941.160.33 - 4.160.8000
  Active19 (33%)3 (15.79%)0.00 - 32.711.00
IgG4
  > 140 mg/dL10 (17.8%)2 (20%)0.00 - 45.581.230.21 - 7.150.8000
  < 140 mg/dL46 (82.2%)8 (17.39%)6.09 - 28.691.00
Azathioprine
  No23 (41%)4 (17.39%)1.41 - 33.371
  Yes33 (59%)6 (21.21%)4.60 - 31.761.180.24 - 5.930.8000
Corticosteroids
  No25 (40%)5 (20%)3.82 - 36.181.00
  Yes31 (60%)5 (16.13%)2.77 - 29.491.040.23 - 4.730.9000